An Economic Geography of the United States
Introducing Economic Megaregions
In this November 2016 article, Nelson and Rae propose a partition of the United States into megaregion based on clustering analysis of 4 million commute routes.
The partition looks as follow: 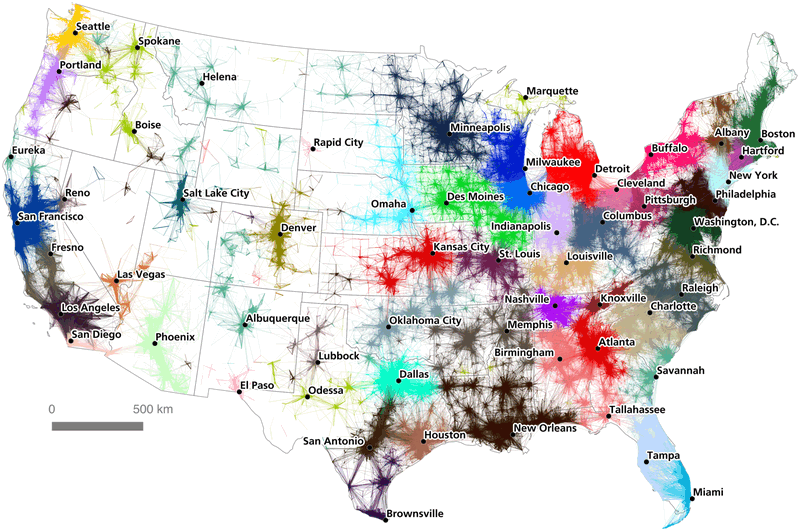 .
.
The authors explains the difficulty of reaching a clear-cut definition: an automated algorithm may come to rely on insufficient data, leading to boundaries that change too much through time, whereas a human cartographer's definition entails some arbitrary choices.
The article quotes the assertion that "knowledge is only gained through orderly loss of information". Don't miss the mise en abime implied once one questions how orderliness is known.
In any case, the algorithmic map and the human made appear to agree substantially. This map shows 55 cities that form nexus of commute routes, the regions around these cities are economically connected.
The next step as an out of state investor is to consider the potential of each given region, as given by its size and long term demographic evolution, and affordability, for this, we will consider area partitioning that allow more details.
Statistical Areas defined for US Census
Analyzing commute routes to identify economic ties is not new. The USOMB (U.S. Office of Management and Budget) which gathers census statistics is using this technique for its definition of MSA (Metropolitan Statistical Area) along similar lines. There are also Micropolitan Statistical Area, that define economically connected rural communities that do not have a large city as a nexus point
The MSA are then combined into CSA (combined statistical areas) as some criteria of economic interconnection are verified.
Fastest Growing Combined Statistical Areas
There is much to say about a beautiful visualisation, and the CSA map does not look as attractive to the human eye as the above Mega-region map:
CSA population changes at a slower pace than their constituent MSA due to averaging, we show here the most dynamic CSA with a population above 500,000. The data was obtained from wikipedia in Dec 2016.
| Rank | Combined.Statistical.Area | 2015 Estimate | Cumulative Change |
|---|---|---|---|
| 1 | Cape Coral-Fort Myers-Naples, FL | 1,059,287 | 12.66% |
| 2 | Houston-The Woodlands, TX | 6,855,069 | 12.11% |
| 3 | Orlando-Deltona-Daytona Beach, FL | 3,129,308 | 11.04% |
| 4 | Raleigh-Durham-Chapel Hill, NC | 2,117,103 | 10.68% |
| 5 | Denver-Aurora, CO | 3,418,876 | 10.61% |
| 6 | Dallas-Fort Worth, TX-OK | 7,504,362 | 10.08% |
| 7 | Nashville-Davidson?Murfreesboro, TN | 1,951,644 | 9.13% |
| 8 | North Port-Sarasota-Bradenton, FL | 977,491 | 8.96% |
| 9 | Charlotte-Concord, NC-SC | 2,583,956 | 8.77% |
| 10 | Salt Lake City-Provo-Orem, UT | 2,467,709 | 8.63% |
| 11 | McAllen-Edinburg, TX | 906,099 | 8.42% |
| 12 | Boise City-Mountain Home-Ontario, ID-OR | 756,061 | 8.39% |
| 13 | Des Moines-Ames-West Des Moines, IA | 782,390 | 8.32% |
| 14 | Oklahoma City-Shawnee, OK | 1,430,327 | 8.16% |
| 15 | Miami-Fort Lauderdale-Port St. Lucie, FL | 6,654,565 | 7.91% |
| 16 | Atlanta-Athens-Clarke-Sandy Springs | 6,365,108 | 7.70% |
| 17 | Seattle-Tacoma, WA | 4,602,591 | 7.67% |
| 18 | Las Vegas-Henderson, NV-AZ | 2,362,015 | 7.59% |
| 19 | Columbus-Auburn-Opelika, GA-AL | 504,865 | 7.57% |
| 20 | Savannah-Hinesville-Statesboro, GA | 532,048 | 7.32% |
| 21 | Jacksonville-St. Marys-Palatka, FL-GA | 1,573,606 | 7.01% |
| 22 | San Jose-San Francisco-Oakland, CA | 8,713,914 | 6.87% |
| 23 | Portland-Vancouver-Salem, OR-WA | 3,110,906 | 6.49% |
| 24 | Washington-Baltimore-Arlington, DC-MD-VA-WV-PA | 9,625,360 | 6.33% |
| 25 | New Orleans-Metairie-Hammond, LA-MS | 1,493,205 | 5.60% |
| 26 | Omaha-Council Bluffs-Fremont, NE-IA | 952,018 | 5.54% |
| 27 | Sacramento-Roseville, CA | 2,544,026 | 5.35% |
| 28 | Lexington-Fayette Richmond Frankfort, KY | 723,849 | 5.34% |
| 29 | Columbus-Marion-Zanesville, OH | 2,424,831 | 5.04% |
Fastest Growing Metropolitan Statistical Areas
The MSA map looks as follow, these areas, though still very large show even more disparity in population evolution that CSA.

- iweblists gives here a list of the 100 largest ones with a convenient possibility to sort by population evolution from 2000 to 2010 census.
- wikipedia features a more complete list with all 382 areas.
Putting the data together allows to check that the long term trend is persistent, and get the top areas in the US:
| Rank | Metropolitan Statistical Area | 2015 Estimate | 2010-2015 yoy | 2000-2010 yoy | Cumul Change |
|---|---|---|---|---|---|
| 1 | Austin-Round Rock-San Marcos, TX | 2,000,860 | 3.90% | 2.83% | 60.10% |
| 2 | Raleigh-Cary, NC | 1,273,568 | 3.19% | 3.17% | 59.78% |
| 3 | Cape Coral-Fort Myers, FL | 701,982 | 3.43% | 3.01% | 59.22% |
| 4 | Greenville-Mauldin-Easley, SC | 874,869 | 6.97% | 1.10% | 56.24% |
| 5 | Provo-Orem, UT | 585,799 | 1.61% | 3.68% | 55.48% |
| 6 | Las Vegas-Paradise, NV | 2,114,801 | 2.54% | 3.09% | 53.72% |
| 7 | McAllen-Edinburg-Mission, TX | 842,304 | 3.00% | 2.47% | 47.91% |
| 8 | Boise City-Nampa, ID | 676,909 | 2.45% | 2.58% | 45.62% |
| 9 | Ogden-Clearfield, UT | 642,850 | 3.88% | 1.85% | 45.23% |
| 10 | Orlando-Kissimmee-Sanford, FL | 2,387,138 | 3.05% | 2.25% | 45.15% |
| 11 | Houston-Sugar Land-Baytown, TX | 6,656,947 | 3.05% | 1.96% | 41.17% |
| 12 | Phoenix-Mesa-Glendale, AZ | 4,574,531 | 1.33% | 2.79% | 40.67% |
| 13 | Charlotte-Gastonia-Rock Hill, NC-SC | 2,426,363 | 1.82% | 2.49% | 39.99% |
| 14 | Nashville-Davidson--Murfreesboro--Franklin, TN | 1,830,345 | 3.37% | 1.69% | 39.53% |
| 15 | San Antonio-New Braunfels, TX | 2,384,075 | 3.25% | 1.73% | 39.28% |
| 16 | Riverside-San Bernardino-Ontario, CA | 4,489,159 | 1.75% | 2.37% | 37.92% |
| 17 | Dallas-Fort Worth-Arlington, TX | 7,102,796 | 2.43% | 2.01% | 37.61% |
| 18 | Charleston-North Charleston-Summerville, SC | 744,526 | 2.93% | 1.62% | 35.61% |
| 19 | Atlanta-Sandy Springs-Marietta, GA | 5,710,795 | 1.21% | 2.38% | 34.44% |
| 20 | Lakeland-Winter Haven, FL | 650,092 | 2.29% | 1.84% | 34.34% |
| 21 | Bakersfield-Delano, CA | 882,176 | 1.96% | 1.92% | 33.33% |
| 22 | Indianapolis-Carmel, IN | 1,988,817 | 3.00% | 1.18% | 30.41% |
| 23 | North Port-Bradenton-Sarasota, FL | 768,918 | 2.25% | 1.55% | 30.33% |
| 24 | Colorado Springs, CO | 697,856 | 2.47% | 1.40% | 29.84% |
| 25 | Des Moines-West Des Moines, IA | 622,899 | 2.29% | 1.46% | 29.39% |
| 26 | Denver-Aurora-Broomfield, CO | 2,814,330 | 2.34% | 1.41% | 29.14% |
| 27 | Jacksonville, FL | 1,449,481 | 1.99% | 1.58% | 29.10% |
| 28 | Stockton, CA | 726,106 | 1.55% | 1.78% | 28.83% |
| 29 | Madison, WI | 641,385 | 2.70% | 1.13% | 27.82% |
| 30 | Washington-Arlington-Alexandria, DC-VA-MD-WV | 6,097,684 | 2.62% | 1.11% | 27.14% |
| 31 | Sacramento--Arden-Arcade--Roseville, CA | 2,274,194 | 1.51% | 1.62% | 26.57% |
| 32 | Columbia, SC | 810,068 | 2.16% | 1.18% | 25.17% |
| 33 | Tampa-St. Petersburg-Clearwater, FL | 2,975,225 | 1.71% | 1.33% | 24.17% |
| 34 | Oklahoma City, OK | 1,358,452 | 2.41% | 0.97% | 24.01% |
| 35 | Portland-Vancouver-Hillsboro, OR-WA | 2,389,228 | 1.60% | 1.36% | 23.93% |
| 36 | Seattle-Tacoma-Bellevue, WA | 3,733,580 | 2.22% | 0.95% | 22.66% |
| 37 | Salt Lake City, UT | 1,170,266 | 0.96% | 1.42% | 20.79% |
| Tweet |
| |
| Click here to share this on BiggerPockets.com! | ||