Economic Geography of the United States: 2021 update
Our last study of the US demographics dates back to 2016. We now have 2020 census data. The tables below are rather long because I made the editorial choice to convey complete information as opposed to showing a top 5 list. For those readers located in the US, you can check the ranking and demographic growth of your metrpolitan area below.
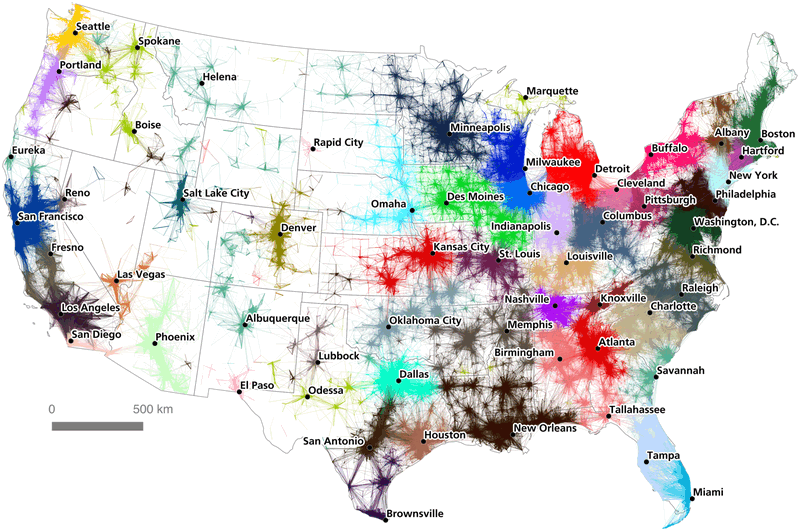
As for eye candy, we offer again the connected map of commutes below:
Executive Summary
The partition of US geography in Combined Statistical Areas (CSA) enables us to obtain information on population trends.
While there is politicized noise about people leaving high-tax mega-cities in Cali and NY, the numbers available do not support this. Still, these areas are less affordable and politics can lead to lower rental yield and landlord legal protection. We look at factual census data:
- depopulation is fastest in the smaller towns, depopulating CSA where the largest town is small, such as Cleveland Mississippi (pop 12,000), Johnston PA (pop 20,000, was 60,000 in 1920) or Dixon IL (pop 15,000) show that smalltown USA can have a hard time.
- Legacy megacities NY, LA, Wa, Ch, SF are either attracting population or stable. Despite all the talk about their high price, they saw 0% to 8% cumulative growth over 10 years
- Dynamics megacities such as DFW grew 20% over the 10 years
- the winners keep winning: the Carolinas, FL, OR, TX keep growing at up to 3% annualized growth
Depopulation is a much slower process than demographic growth. Only one CSA has more than 1% population reduction per year at 1.5%. The 21 most attractive population grow by faster than 1.5% per year. Some even grow 3% per year.
The tables below illustrate how small 1% per year population compounds over decades. This puts upward or downward price pressure on the housing stock over decades. We recommend joining this data with our earlier net rental yield comparison article.
Most Dynamic Combined Statistical Areas
There are 170 CSA statistical areas. Below are their population and annualized growth over the last 10 years:
| Rank | Metropolitan statistical area | 2020 estimate | 2010 Census | % change | annual % | Encompassing combined statistical area |
|---|---|---|---|---|---|---|
| 1 | Myrtle Beach-Conway-North Myrtle Beach, SC-NC MSA | 514488 | 376722 | 36.6% | 3.2% | Myrtle Beach-Conway, SC-NC CSA |
| 2 | Austin-Round Rock-Georgetown, TX MSA | 2295303 | 1716289 | 33.7% | 2.9% | |
| 3 | Cape Coral-Fort Myers, FL MSA | 790767 | 618754 | 27.8% | 2.5% | Cape Coral-Fort Myers-Naples, FL CSA |
| 4 | Provo-Orem, UT MSA | 663181 | 526810 | 25.9% | 2.3% | Salt Lake City-Provo-Orem, UT CSA |
| 5 | Raleigh-Cary, NC MSA | 1420376 | 1130490 | 25.6% | 2.3% | Raleigh-Durham-Cary, NC CSA |
| 6 | Boise City, ID MSA | 770353 | 616561 | 24.9% | 2.3% | Boise City-Mountain Home-Ontario, ID-OR CSA |
| 7 | Fayetteville-Springdale-Rogers, AR MSA | 548634 | 440121 | 24.7% | 2.2% | |
| 8 | Orlando-Kissimmee-Sanford, FL MSA | 2639374 | 2134411 | 23.7% | 2.1% | Orlando-Lakeland-Deltona, FL CSA |
| 9 | Lakeland-Winter Haven, FL MSA | 744552 | 602095 | 23.7% | 2.1% | Orlando-Lakeland-Deltona, FL CSA |
| 10 | Charleston-North Charleston, SC MSA | 819705 | 664607 | 23.3% | 2.1% | |
| 11 | North Port-Sarasota-Bradenton, FL MSA | 854684 | 702281 | 21.7% | 2.0% | North Port-Sarasota, FL CSA |
| 12 | San Antonio-New Braunfels, TX MSA | 2590732 | 2142508 | 20.9% | 1.9% | |
| 13 | Dallas-Fort Worth-Arlington, TX MSA | 7694138 | 6366542 | 20.9% | 1.9% | Dallas-Fort Worth, TX-OK CSA |
| 14 | Houston-The Woodlands-Sugar Land, TX MSA | 7154478 | 5920416 | 20.8% | 1.9% | Houston-The Woodlands, TX CSA |
| 15 | Phoenix-Mesa-Chandler, AZ MSA | 5059909 | 4192887 | 20.7% | 1.9% | Phoenix-Mesa, AZ CSA |
| 16 | Charlotte-Concord-Gastonia, NC-SC MSA | 2684276 | 2243960 | 19.6% | 1.8% | Charlotte-Concord, NC-SC CSA |
| 17 | Nashville-Davidson-Murfreesboro-Franklin, TN MSA | 1961232 | 1646200 | 19.1% | 1.8% | Nashville-Davidson-Murfreesboro, TN CSA |
| 18 | Las Vegas-Henderson-Paradise, NV MSA | 2315963 | 1951269 | 18.7% | 1.7% | Las Vegas-Henderson, NV-AZ CSA |
| 19 | Jacksonville, FL MSA | 1587892 | 1345596 | 18.0% | 1.7% | Jacksonville-St. Marys-Palatka, FL-GA CSA |
| 20 | Denver-Aurora-Lakewood, CO MSA | 2991231 | 2543482 | 17.6% | 1.6% | Denver-Aurora, CO CSA |
| 21 | Seattle-Tacoma-Bellevue, WA MSA | 4018598 | 3439809 | 16.8% | 1.6% | Seattle-Tacoma, WA CSA |
| 22 | Colorado Springs, CO MSA | 753839 | 645613 | 16.8% | 1.6% | |
| 23 | Des Moines-West Des Moines, IA MSA | 707915 | 606475 | 16.7% | 1.6% | Des Moines-Ames-West Des Moines, IA CSA |
| 24 | Tampa-St. Petersburg-Clearwater, FL MSA | 3243963 | 2783243 | 16.6% | 1.5% | |
| 25 | Ogden-Clearfield, UT MSA | 691359 | 597159 | 15.8% | 1.5% | Salt Lake City-Provo-Orem, UT CSA |
| 26 | Durham-Chapel Hill, NC MSA | 652542 | 564273 | 15.6% | 1.5% | Raleigh-Durham-Cary, NC CSA |
| 27 | Deltona-Daytona Beach-Ormond Beach, FL MSA | 679948 | 590289 | 15.2% | 1.4% | Orlando-Lakeland-Deltona, FL CSA |
| 28 | Atlanta-Sandy Springs-Alpharetta, GA MSA | 6087762 | 5286728 | 15.2% | 1.4% | Atlanta-Athens-Clarke County-Sandy Springs, GA-AL CSA |
| 29 | Salt Lake City, UT MSA | 1240029 | 1087873 | 14.0% | 1.3% | Salt Lake City-Provo-Orem, UT CSA |
| 30 | Oklahoma City, OK MSA | 1425375 | 1252987 | 13.8% | 1.3% | Oklahoma City-Shawnee, OK CSA |
| 31 | Greenville-Anderson, SC MSA | 932705 | 824112 | 13.2% | 1.2% | Greenville-Spartanburg-Anderson, SC CSA |
| 32 | McAllen-Edinburg-Mission, TX MSA | 875200 | 774769 | 13.0% | 1.2% | McAllen-Edinburg, TX CSA |
| 33 | Portland-Vancouver-Hillsboro, OR-WA MSA | 2510259 | 2226009 | 12.8% | 1.2% | Portland-Vancouver-Salem, OR-WA CSA |
| 34 | Columbus, OH MSA | 2138946 | 1901974 | 12.5% | 1.2% | Columbus-Marion-Zanesville, OH CSA |
| 35 | Stockton, CA MSA | 767967 | 685306 | 12.1% | 1.1% | San Jose-San Francisco-Oakland, CA CSA |
| 36 | Palm Bay-Melbourne-Titusville, FL MSA | 608459 | 543376 | 12.0% | 1.1% | Orlando-Lakeland-Deltona, FL CSA |
| 37 | Washington-Arlington-Alexandria, DC-VA-MD-WV MSA | 6324629 | 5649540 | 12.0% | 1.1% | Washington-Baltimore-Arlington, DC-MD-VA-WV-PA CSA |
| 38 | Spokane-Spokane Valley, WA MSA | 574585 | 514752 | 11.6% | 1.1% | Spokane-Spokane Valley-Coeur d'Alene, WA-ID CSA |
| 39 | Miami-Fort Lauderdale-West Palm Beach, FL MSA | 6173008 | 5564635 | 10.9% | 1.0% | Miami-Port St. Lucie-Fort Lauderdale, FL CSA |
| 40 | Indianapolis-Carmel-Anderson, IN MSA | 2091019 | 1887877 | 10.8% | 1.0% | Indianapolis-Carmel-Muncie, IN CSA |
| 41 | Madison, WI MSA | 670447 | 605435 | 10.7% | 1.0% | Madison-Janesville-Beloit, WI CSA |
| 42 | Riverside-San Bernardino-Ontario, CA MSA | 4678371 | 4224851 | 10.7% | 1.0% | Los Angeles-Long Beach, CA CSA |
| 43 | Sacramento-Roseville-Folsom, CA MSA | 2374749 | 2149127 | 10.5% | 1.0% | Sacramento-Roseville, CA CSA |
| 44 | Columbia, SC MSA | 847397 | 767598 | 10.4% | 1.0% | Columbia-Orangeburg-Newberry, SC CSA |
| 45 | Omaha-Council Bluffs, NE-IA MSA | 954270 | 865350 | 10.3% | 1.0% | Omaha-Council Bluffs-Fremont, NE-IA CSA |
| 46 | Lexington-Fayette, KY MSA | 520391 | 472099 | 10.2% | 1.0% | Lexington-Fayette-Richmond-Frankfort, KY CSA |
| 47 | Fayetteville, NC MSA | 529252 | 481061 | 10.0% | 1.0% | Fayetteville-Lumberton-Laurinburg, NC CSA |
| 48 | Richmond, VA MSA | 1303469 | 1186501 | 9.9% | 0.9% | |
| 49 | Minneapolis-St. Paul-Bloomington, MN-WI MSA | 3657477 | 3346859 | 9.3% | 0.9% | Minneapolis-St. Paul, MN-WI CSA |
| 50 | Grand Rapids-Kentwood, MI MSA | 1081372 | 993670 | 8.8% | 0.8% | Grand Rapids-Kentwood-Muskegon, MI CSA |
| 51 | Augusta-Richmond County, GA-SC MSA | 614312 | 564873 | 8.8% | 0.8% | |
| 52 | San Francisco-Oakland-Berkeley, CA MSA | 4696902 | 4335391 | 8.3% | 0.8% | San Jose-San Francisco-Oakland, CA CSA |
| 53 | Tucson, AZ MSA | 1061175 | 980263 | 8.3% | 0.8% | Tucson-Nogales, AZ CSA |
| 54 | Kansas City, MO-KS MSA | 2173212 | 2009342 | 8.2% | 0.8% | Kansas City-Overland Park-Kansas City, MO-KS CSA |
| 55 | Chattanooga, TN-GA MSA | 569931 | 528143 | 7.9% | 0.8% | Chattanooga-Cleveland-Dalton, TN-GA-AL CSA |
| 56 | Knoxville, TN MSA | 878124 | 814914 | 7.8% | 0.8% | Knoxville-Morristown-Sevierville, TN CSA |
| 57 | San Diego-Chula Vista-Carlsbad, CA MSA | 3332427 | 3095313 | 7.7% | 0.7% | |
| 58 | Fresno, CA MSA | 1000918 | 930450 | 7.6% | 0.7% | Fresno-Madera-Hanford, CA CSA |
| 59 | Tulsa, OK MSA | 1006411 | 937478 | 7.4% | 0.7% | Tulsa-Muskogee-Bartlesville, OK CSA |
| 60 | Bakersfield, CA MSA | 901362 | 839631 | 7.4% | 0.7% | |
| 61 | San Jose-Sunnyvale-Santa Clara, CA MSA | 1971160 | 1836911 | 7.3% | 0.7% | San Jose-San Francisco-Oakland, CA CSA |
| 62 | Greensboro-High Point, NC MSA | 776363 | 723801 | 7.3% | 0.7% | Greensboro-Winston-Salem-High Point, NC CSA |
| 63 | Boston-Cambridge-Newton, MA-NH MSA | 4878211 | 4552402 | 7.2% | 0.7% | Boston-Worcester-Providence, MA-RI-NH-CT CSA |
| 64 | Modesto, CA MSA | 550081 | 514453 | 6.9% | 0.7% | San Jose-San Francisco-Oakland, CA CSA |
| 65 | New Orleans-Metairie, LA MSA | 1272258 | 1189866 | 6.9% | 0.7% | New Orleans-Metairie-Hammond, LA-MS CSA |
| 66 | Little Rock-North Little Rock-Conway, AR MSA | 746564 | 699757 | 6.7% | 0.6% | Little Rock-North Little Rock, AR CSA |
| 67 | Winston-Salem, NC MSA | 679948 | 640595 | 6.1% | 0.6% | Greensboro-Winston-Salem-High Point, NC CSA |
| 68 | Harrisburg-Carlisle, PA MSA | 581943 | 549475 | 5.9% | 0.6% | Harrisburg-York-Lebanon, PA CSA |
| 69 | Portland-South Portland, ME MSA | 543221 | 514098 | 5.7% | 0.6% | Portland-Lewiston-South Portland, ME CSA |
| 70 | Louisville/Jefferson County, KY-IN MSA | 1268993 | 1202718 | 5.5% | 0.5% | Louisville/Jefferson County-Elizabethtown-Bardstown, KY-IN CSA |
| 71 | El Paso, TX MSA | 846399 | 804123 | 5.3% | 0.5% | El Paso-Las Cruces, TX-NM CSA |
| 72 | Lancaster, PA MSA | 546192 | 519445 | 5.2% | 0.5% | |
| 73 | Cincinnati, OH-KY-IN MSA | 2232907 | 2137667 | 4.5% | 0.4% | Cincinnati-Wilmington-Maysville, OH-KY-IN CSA |
| 74 | Albuquerque, NM MSA | 923630 | 887077 | 4.1% | 0.4% | Albuquerque-Santa Fe-Las Vegas, NM CSA |
| 75 | Baton Rouge, LA MSA | 858571 | 825905 | 4.0% | 0.4% | |
| 76 | Virginia Beach-Norfolk-Newport News, VA-NC MSA | 1779824 | 1713954 | 3.8% | 0.4% | Virginia Beach-Norfolk, VA-NC CSA |
| 77 | Wichita, KS MSA | 643768 | 623061 | 3.3% | 0.3% | Wichita-Winfield, KS CSA |
| 78 | Baltimore-Columbia-Towson, MD MSA | 2800189 | 2710489 | 3.3% | 0.3% | Washington-Baltimore-Arlington, DC-MD-VA-WV-PA CSA |
| 79 | Worcester, MA-CT MSA | 945752 | 916980 | 3.1% | 0.3% | Boston-Worcester-Providence, MA-RI-NH-CT CSA |
| 80 | Allentown-Bethlehem-Easton, PA-NJ MSA | 846399 | 821173 | 3.1% | 0.3% | |
| 81 | Birmingham-Hoover, AL MSA | 1091921 | 1061024 | 2.9% | 0.3% | Birmingham-Hoover-Talladega, AL CSA |
| 82 | Bridgeport-Stamford-Norwalk, CT MSA | 942426 | 916829 | 2.8% | 0.3% | New York-Newark, NY-NJ-CT-PA CSA |
| 83 | Lansing-East Lansing, MI MSA | 548248 | 534684 | 2.5% | 0.3% | |
| 84 | Memphis, TN-MS-AR MSA | 1348678 | 1316100 | 2.5% | 0.2% | Memphis-Forrest City, TN-MS-AR CSA |
| 85 | Philadelphia-Camden-Wilmington, PA-NJ-DE-MD MSA | 6107906 | 5965343 | 2.4% | 0.2% | Philadelphia-Reading-Camden, PA-NJ-DE-MD CSA |
| 86 | Los Angeles-Long Beach-Anaheim, CA MSA | 13109903 | 12828837 | 2.2% | 0.2% | Los Angeles-Long Beach, CA CSA |
| 87 | Oxnard-Thousand Oaks-Ventura, CA MSA | 841387 | 823318 | 2.2% | 0.2% | Los Angeles-Long Beach, CA CSA |
| 88 | Providence-Warwick, RI-MA MSA | 1623890 | 1600852 | 1.4% | 0.1% | Boston-Worcester-Providence, MA-RI-NH-CT CSA |
| 89 | Milwaukee-Waukesha, WI MSA | 1577676 | 1555908 | 1.4% | 0.1% | Milwaukee-Racine-Waukesha, WI CSA |
| 90 | Dayton-Kettering, OH MSA | 809248 | 799232 | 1.3% | 0.1% | Dayton-Springfield-Kettering, OH CSA |
| 91 | Poughkeepsie-Newburgh-Middletown, NY MSA | 678527 | 670301 | 1.2% | 0.1% | New York-Newark, NY-NJ-CT-PA CSA |
| 92 | New York City-Newark-Jersey City, NY-NJ-PA MSA | 19124359 | 18897109 | 1.2% | 0.1% | New York-Newark, NY-NJ-CT-PA CSA |
| 93 | Urban Honolulu, HI MSA | 963826 | 953207 | 1.1% | 0.1% | |
| 94 | Albany-Schenectady-Troy, NY MSA | 878550 | 870716 | 0.9% | 0.1% | Albany-Schenectady, NY CSA |
| 95 | St. Louis, MO-IL MSA | 2805473 | 2787701 | 0.6% | 0.1% | St. Louis-St. Charles-Farmington, MO-IL CSA |
| 96 | Jackson, MS MSA | 589082 | 586320 | 0.5% | 0.0% | Jackson-Vicksburg-Brookhaven, MS CSA |
| 97 | Springfield, MA MSA | 695654 | 692942 | 0.4% | 0.0% | |
| 98 | Detroit-Warren-Dearborn, MI MSA | 4304136 | 4296250 | 0.2% | 0.0% | Detroit-Warren-Ann Arbor, MI CSA |
| 99 | Akron, OH MSA | 701449 | 703200 | -0.3% | 0.0% | Cleveland-Akron-Canton, OH CSA |
| 100 | Chicago-Naperville-Elgin, IL-IN-WI MSA | 9406638 | 9461105 | -0.6% | -0.1% | Chicago-Naperville, IL-IN-WI CSA |
| 101 | Buffalo-Niagara Falls, NY MSA | 1125637 | 1135509 | -0.9% | -0.1% | Buffalo-Cheektowaga-Cattaraugus, NY CSA |
| 102 | Hartford-East Hartford-Middletown, CT MSA | 1201483 | 1212381 | -0.9% | -0.1% | Hartford-East Hartford, CT CSA |
| 103 | Rochester, NY MSA | 1067486 | 1079671 | -1.1% | -0.1% | Rochester-Batavia-Seneca Falls, NY CSA |
| 104 | New Haven-Milford, CT MSA | 851948 | 862477 | -1.2% | -0.1% | New York-Newark, NY-NJ-CT-PA CSA |
| 105 | Toledo, OH MSA | 641549 | 651429 | -1.5% | -0.2% | Toledo-Findlay-Tiffin, OH CSA |
| 106 | Cleveland-Elyria, OH MSA | 2043807 | 2077240 | -1.6% | -0.2% | Cleveland-Akron-Canton, OH CSA |
| 107 | Scranton-Wilkes-Barre, PA MSA | 552528 | 563631 | -2.0% | -0.2% | |
| 108 | Pittsburgh, PA MSA | 2309246 | 2356285 | -2.0% | -0.2% | Pittsburgh-New Castle-Weirton, PA-OH-WV CSA |
| 109 | Syracuse, NY MSA | 646038 | 662577 | -2.5% | -0.3% | Syracuse-Auburn, NY CSA |
| 110 | Youngstown-Warren-Boardman, OH-PA MSA | 531420 | 565773 | -6.1% | -0.6% | Youngstown-Warren, OH-PA CSA |
Most Dynamic MSA with Greater than Half Million Population
A large population of more than 1 million is generally best to ensure a wide choice of property managers, contractors, etc. We widen the net to 0.5m areas.
| Rank | Combined statistical area | 2020 estimate | 2010 Census | Change | Annual Chg |
|---|---|---|---|---|---|
| 1 | Myrtle Beach-Conway, SC-NC Combined Statistical Area | 577841 | 436880 | 32.3% | 2.8% |
| 2 | Bend-Prineville, OR Combined Statistical Area | 226874 | 178711 | 27.0% | 2.4% |
| 3 | Midland-Odessa, TX Combined Statistical Area | 351380 | 278801 | 26.0% | 2.3% |
| 4 | Cape Coral-Fort Myers-Naples, FL Combined Statistical Area | 1226553 | 979414 | 25.2% | 2.3% |
| 5 | Orlando-Lakeland-Deltona, FL Combined Statistical Area | 4229714 | 3447946 | 22.7% | 2.1% |
| 6 | Boise City-Mountain Home-Ontario, ID-OR Combined Statistical Area | 853555 | 697535 | 22.4% | 2.0% |
| 7 | Raleigh-Durham-Cary, NC Combined Statistical Area | 2117636 | 1740185 | 21.7% | 2.0% |
| 8 | North Port-Sarasota, FL Combined Statistical Area | 1087915 | 897121 | 21.3% | 1.9% |
| 9 | San Antonio-New Braunfels-Pearsall, TX Combined Statistical Area | 2611111 | 2159725 | 20.9% | 1.9% |
| 10 | Phoenix-Mesa, AZ Combined Statistical Area | 5114212 | 4246484 | 20.4% | 1.9% |
| 11 | Houston-The Woodlands, TX Combined Statistical Area | 7340823 | 6099977 | 20.3% | 1.9% |
| 12 | Dallas-Fort Worth, TX-OK Combined Statistical Area | 8186093 | 6807747 | 20.3% | 1.9% |
| 13 | Nashville-Davidson-Murfreesboro, TN Combined Statistical Area | 2090859 | 1763744 | 18.6% | 1.7% |
| 14 | Charlotte-Concord, NC-SC Combined Statistical Area | 2846550 | 2402623 | 18.5% | 1.7% |
| 15 | Las Vegas-Henderson, NV Combined Statistical Area | 2364017 | 1995215 | 18.5% | 1.7% |
| 16 | Denver-Aurora, CO Combined Statistical Area | 3652385 | 3090874 | 18.2% | 1.7% |
| 17 | Salt Lake City-Provo-Orem, UT Combined Statistical Area | 2672368 | 2271696 | 17.6% | 1.6% |
| 18 | Fargo-Wahpeton, ND-MN Combined Statistical Area | 270911 | 231674 | 16.9% | 1.6% |
| 19 | Kennewick-Richland-Walla Walla, WA Combined Statistical Area | 364793 | 312121 | 16.9% | 1.6% |
| 20 | Jacksonville-St. Marys-Palatka, FL-GA Combined Statistical Area | 1718095 | 1470473 | 16.8% | 1.6% |
| 21 | Seattle-Tacoma, WA Combined Statistical Area | 4952595 | 4274767 | 15.9% | 1.5% |
| 22 | Atlanta-Athens-Clarke County-Sandy Springs, GA-AL Combined Statistical Area | 6928515 | 6054858 | 14.4% | 1.4% |
| 23 | Des Moines-Ames-West Des Moines, IA Combined Statistical Area | 887967 | 778013 | 14.1% | 1.3% |
| 24 | Spokane-Spokane Valley-Coeur d'Alene, WA-ID Combined Statistical Area | 745213 | 653246 | 14.1% | 1.3% |
| 25 | Rapid City-Spearfish, SD Combined Statistical Area | 170735 | 150479 | 13.5% | 1.3% |
| 26 | Oklahoma City-Shawnee, OK Combined Statistical Area | 1498373 | 1322429 | 13.3% | 1.3% |
| 27 | McAllen-Edinburg, TX Combined Statistical Area | 939466 | 835737 | 12.4% | 1.2% |
| 28 | Pensacola-Ferry Pass, FL-AL Combined Statistical Area | 547784 | 487310 | 12.4% | 1.2% |
| 29 | Portland-Vancouver-Salem, OR-WA Combined Statistical Area | 3282871 | 2921408 | 12.4% | 1.2% |
| 30 | Savannah-Hinesville-Statesboro-Jesup, GA Combined Statistical Area | 590020 | 525844 | 12.2% | 1.2% |
| 31 | Salisbury-Cambridge, MD-DE Combined Statistical Area | 455334 | 406420 | 12.0% | 1.1% |
| 32 | Greenville-Spartanburg-Anderson, SC Combined Statistical Area | 1494306 | 1336656 | 11.8% | 1.1% |
| 33 | Idaho Falls-Rexburg-Blackfoot, ID Combined Statistical Area | 256099 | 229650 | 11.5% | 1.1% |
| 34 | Bowling Green-Glasgow, KY Combined Statistical Area | 235109 | 210871 | 11.5% | 1.1% |
| 35 | Miami-Port St. Lucie-Fort Lauderdale, FL Combined Statistical Area | 6908700 | 6199860 | 11.4% | 1.1% |
| 36 | Reno-Carson City-Fernley, NV Combined Statistical Area | 644730 | 579668 | 11.2% | 1.1% |
| 37 | Jonesboro-Paragould, AR Combined Statistical Area | 181125 | 163116 | 11.0% | 1.1% |
| 38 | Huntsville-Decatur, AL Combined Statistical Area | 634421 | 571422 | 11.0% | 1.1% |
| 39 | Tyler-Jacksonville, TX Combined Statistical Area | 288681 | 260559 | 10.8% | 1.0% |
| 40 | Lincoln-Beatrice, NE Combined Statistical Area | 359267 | 324468 | 10.7% | 1.0% |
| 41 | Moses Lake-Othello, WA Combined Statistical Area | 119404 | 107848 | 10.7% | 1.0% |
| 42 | Pullman-Moscow, WA-ID Combined Statistical Area | 90330 | 82020 | 10.1% | 1.0% |
| 43 | Columbus-Marion-Zanesville, OH Combined Statistical Area | 2541313 | 2308509 | 10.1% | 1.0% |
| 44 | Omaha-Council Bluffs-Fremont, NE-IA Combined Statistical Area | 990492 | 902041 | 9.8% | 0.9% |
| 45 | Sacramento-Roseville, CA Combined Statistical Area | 2650900 | 2414783 | 9.8% | 0.9% |
| 46 | Cedar Rapids-Iowa City, IA Combined Statistical Area | 449617 | 410526 | 9.5% | 0.9% |
| 47 | Lexington-Fayette-Richmond-Frankfort, KY Combined Statistical Area | 749885 | 684789 | 9.5% | 0.9% |
| 48 | Columbus-Auburn-Opelika, GA-AL Combined Statistical Area | 489489 | 448035 | 9.3% | 0.9% |
| 49 | Minneapolis-St. Paul, MN-WI Combined Statistical Area | 4046181 | 3706278 | 9.2% | 0.9% |
| 50 | Lubbock-Plainview-Levelland, TX Combined Statistical Area | 382039 | 350013 | 9.2% | 0.9% |
| 51 | Indianapolis-Carmel-Muncie, IN Combined Statistical Area | 2473639 | 2266569 | 9.1% | 0.9% |
| 52 | Lafayette-West Lafayette-Frankfort, IN Combined Statistical Area | 265484 | 243521 | 9.0% | 0.9% |
| 53 | Washington-Baltimore-Arlington, DC-MD-VA-WV-PA Combined Statistical Area | 9865267 | 9050192 | 9.0% | 0.9% |
| 54 | Asheville-Marion-Brevard, NC Combined Statistical Area | 546914 | 502944 | 8.7% | 0.8% |
| 55 | Gainesville-Lake City, FL Combined Statistical Area | 404971 | 372607 | 8.7% | 0.8% |
| 56 | Madison-Janesville-Beloit, WI Combined Statistical Area | 897980 | 827742 | 8.5% | 0.8% |
| 57 | Kansas City-Overland Park-Kansas City, MO-KS Combined Statistical Area | 2541313 | 2343008 | 8.5% | 0.8% |
| 58 | Medford-Grants Pass, OR Combined Statistical Area | 309897 | 285919 | 8.4% | 0.8% |
| 59 | San Jose-San Francisco-Oakland, CA Combined Statistical Area | 9665000 | 8923942 | 8.3% | 0.8% |
| 60 | Columbia-Orangeburg-Newberry, SC Combined Statistical Area | 971185 | 897607 | 8.2% | 0.8% |
| 61 | Tucson-Nogales, AZ Combined Statistical Area | 1107983 | 1027683 | 7.8% | 0.8% |
| 62 | Fayetteville-Sanford-Lumberton, NC Combined Statistical Area | 859593 | 797499 | 7.8% | 0.8% |
| 63 | Knoxville-Morristown-Sevierville, TN Combined Statistical Area | 1157575 | 1077073 | 7.5% | 0.7% |
| 64 | Columbia-Moberly-Mexico, MO Combined Statistical Area | 259338 | 241330 | 7.5% | 0.7% |
| 65 | Grand Rapids-Kentwood-Muskegon, MI Combined Statistical Area | 1418089 | 1320064 | 7.4% | 0.7% |
| 66 | Mobile-Daphne-Fairhope, AL Combined Statistical Area | 657979 | 612838 | 7.4% | 0.7% |
| 67 | Kerrville-Fredericksburg, TX Combined Statistical Area | 79829 | 74462 | 7.2% | 0.7% |
| 68 | Rochester-Austin, MN Combined Statistical Area | 263212 | 246040 | 7.0% | 0.7% |
| 69 | Greensboro-Winston-Salem-High Point, NC Combined Statistical Area | 1699123 | 1589200 | 6.9% | 0.7% |
| 70 | New Orleans-Metairie-Hammond, LA-MS Combined Statistical Area | 1510672 | 1413965 | 6.8% | 0.7% |
| 71 | Harrisonburg-Staunton, VA Combined Statistical Area | 260025 | 243730 | 6.7% | 0.6% |
| 72 | Tulsa-Muskogee-Bartlesville, OK Combined Statistical Area | 1126243 | 1059444 | 6.3% | 0.6% |
| 73 | Chattanooga-Cleveland-Dalton, TN-GA Combined Statistical Area | 1010980 | 951434 | 6.3% | 0.6% |
| 74 | Fresno-Madera-Hanford, CA Combined Statistical Area | 1311371 | 1234297 | 6.2% | 0.6% |
| 75 | Edwards-Glenwood Springs, CO Combined Statistical Area | 133189 | 125734 | 5.9% | 0.6% |
| 76 | Pueblo-Cañon City, CO Combined Statistical Area | 217690 | 205887 | 5.7% | 0.6% |
| 77 | Morgantown-Fairmont, WV Combined Statistical Area | 196161 | 186127 | 5.4% | 0.5% |
| 78 | El Paso-Las Cruces, TX-NM Combined Statistical Area | 1067454 | 1013356 | 5.3% | 0.5% |
| 79 | Louisville/Jefferson County-Elizabethtown-Bardstown, KY-IN Combined Statistical Area | 1493587 | 1418674 | 5.3% | 0.5% |
| 80 | Fort Wayne-Huntington-Auburn, IN Combined Statistical Area | 643274 | 611712 | 5.2% | 0.5% |
| 81 | Eau Claire-Menomonie, WI Combined Statistical Area | 215449 | 205008 | 5.1% | 0.5% |
| 82 | Boston-Worcester-Providence, MA-RI-NH-CT Combined Statistical Area | 8293925 | 7893376 | 5.1% | 0.5% |
| 83 | Portland-Lewiston-South Portland, ME Combined Statistical Area | 651768 | 621800 | 4.8% | 0.5% |
| 84 | Harrisburg-York-Lebanon, PA Combined Statistical Area | 1276796 | 1219422 | 4.7% | 0.5% |
| 85 | Green Bay-Shawano, WI Combined Statistical Area | 368711 | 352422 | 4.6% | 0.5% |
| 86 | Appleton-Oshkosh-Neenah, WI Combined Statistical Area | 410606 | 392660 | 4.6% | 0.4% |
| 87 | Macon-Bibb County-Warner Robins, GA Combined Statistical Area | 417960 | 399888 | 4.5% | 0.4% |
| 88 | Victoria-Port Lavaca, TX Combined Statistical Area | 120563 | 115384 | 4.5% | 0.4% |
| 89 | Corpus Christi-Kingsville-Alice, TX Combined Statistical Area | 536258 | 513282 | 4.5% | 0.4% |
| 90 | Lake Charles-Jennings, LA Combined Statistical Area | 241521 | 231201 | 4.5% | 0.4% |
| 91 | Cincinnati-Wilmington-Maysville, OH-KY-IN Combined Statistical Area | 2291863 | 2197197 | 4.3% | 0.4% |
| 92 | Bloomington-Bedford, IN Combined Statistical Area | 214548 | 205683 | 4.3% | 0.4% |
| 93 | Los Angeles-Long Beach, CA Combined Statistical Area | 18629661 | 17877006 | 4.2% | 0.4% |
| 94 | Mankato-New Ulm, MN Combined Statistical Area | 127569 | 122633 | 4.0% | 0.4% |
| 95 | Brownsville-Harlingen-Raymondville, TX Combined Statistical Area | 445341 | 428354 | 4.0% | 0.4% |
| 96 | Little Rock-North Little Rock, AR Combined Statistical Area | 911571 | 877091 | 3.9% | 0.4% |
| 97 | Virginia Beach-Norfolk, VA-NC Combined Statistical Area | 1871410 | 1801988 | 3.9% | 0.4% |
| 98 | Amarillo-Pampa-Borger, TX Combined Statistical Area | 308909 | 297547 | 3.8% | 0.4% |
| 99 | Greenville-Kinston-Washington, NC Combined Statistical Area | 285717 | 275402 | 3.8% | 0.4% |
| 100 | Steamboat Springs-Craig, CO Combined Statistical Area | 38704 | 37304 | 3.8% | 0.4% |
| 101 | Albuquerque-Santa Fe-Las Vegas, NM Combined Statistical Area | 1165181 | 1123717 | 3.7% | 0.4% |
| 102 | Hot Springs-Malvern, AR Combined Statistical Area | 133576 | 128947 | 3.6% | 0.4% |
| 103 | Burlington-South Burlington-Barre, VT Combined Statistical Area | 279488 | 270795 | 3.2% | 0.3% |
| 104 | Wichita-Winfield, KS Combined Statistical Area | 678396 | 659372 | 2.9% | 0.3% |
| 105 | Hattiesburg-Laurel, MS Combined Statistical Area | 253879 | 247233 | 2.7% | 0.3% |
| 106 | Lafayette-Opelousas-Morgan City, LA Combined Statistical Area | 619529 | 604784 | 2.4% | 0.2% |
| 107 | Tupelo-Corinth, MS Combined Statistical Area | 203090 | 198601 | 2.3% | 0.2% |
| 108 | Birmingham-Hoover-Talladega, AL Combined Statistical Area | 1319564 | 1290744 | 2.2% | 0.2% |
| 109 | Kalamazoo-Battle Creek-Portage, MI Combined Statistical Area | 503840 | 493020 | 2.2% | 0.2% |
| 110 | Memphis-Forrest City, TN-MS-AR Combined Statistical Area | 1373360 | 1344358 | 2.2% | 0.2% |
| 111 | Philadelphia-Reading-Camden, PA-NJ-DE-MD Combined Statistical Area | 7214065 | 7067807 | 2.1% | 0.2% |
| 112 | State College-DuBois, PA Combined Statistical Area | 240108 | 235632 | 1.9% | 0.2% |
| 113 | Joplin-Miami, MO-OK Combined Statistical Area | 210978 | 207366 | 1.7% | 0.2% |
| 114 | Dothan-Ozark, AL Combined Statistical Area | 199173 | 195890 | 1.7% | 0.2% |
| 115 | Milwaukee-Racine-Waukesha, WI Combined Statistical Area | 2049805 | 2025989 | 1.2% | 0.1% |
| 116 | Redding-Red Bluff, CA Combined Statistical Area | 243521 | 240686 | 1.2% | 0.1% |
| 117 | South Bend-Elkhart-Mishawaka, IN-MI Combined Statistical Area | 807350 | 798005 | 1.2% | 0.1% |
| 118 | New York-Newark, NY-NJ-CT-PA Combined Statistical Area | 22491979 | 22255491 | 1.1% | 0.1% |
| 119 | Johnson City-Kingsport-Bristol, TN-VA Combined Statistical Area | 512723 | 508260 | 0.9% | 0.1% |
| 120 | St. Louis-St. Charles-Farmington, MO-IL Combined Statistical Area | 2909003 | 2892497 | 0.6% | 0.1% |
| 121 | Spencer-Spirit Lake, IA Combined Statistical Area | 33525 | 33334 | 0.6% | 0.1% |
| 122 | Dayton-Springfield-Kettering, OH Combined Statistical Area | 1081343 | 1080044 | 0.1% | 0.0% |
| 123 | Detroit-Warren-Ann Arbor, MI Combined Statistical Area | 5323779 | 5318744 | 0.1% | 0.0% |
| 124 | Cape Girardeau-Sikeston, MO-IL Combined Statistical Area | 135408 | 135466 | 0.0% | 0.0% |
| 125 | Wausau-Stevens Point-Wisconsin Rapids, WI Combined Statistical Area | 306751 | 307574 | -0.3% | 0.0% |
| 126 | New Bern-Morehead City, NC Combined Statistical Area | 192756 | 193271 | -0.3% | 0.0% |
| 127 | Jackson-Vicksburg-Brookhaven, MS Combined Statistical Area | 667859 | 669962 | -0.3% | 0.0% |
| 128 | Albany-Schenectady, NY Combined Statistical Area | 1164428 | 1168485 | -0.4% | 0.0% |
| 129 | Chicago-Naperville, IL-IN-WI Combined Statistical Area | 9770485 | 9840929 | -0.7% | -0.1% |
| 130 | Scottsboro-Fort Payne, AL Combined Statistical Area | 123240 | 124336 | -0.9% | -0.1% |
| 131 | Bloomington-Pontiac, IL Combined Statistical Area | 206670 | 208522 | -0.9% | -0.1% |
| 132 | Davenport-Moline, IA-IL Combined Statistical Area | 466545 | 471551 | -1.1% | -0.1% |
| 133 | Buffalo-Cheektowaga-Olean, NY Combined Statistical Area | 1201500 | 1215826 | -1.2% | -0.1% |
| 134 | Jackson-Brownsville, TN Combined Statistical Area | 196133 | 198481 | -1.2% | -0.1% |
| 135 | Kokomo-Peru, IN Combined Statistical Area | 118060 | 119655 | -1.3% | -0.1% |
| 136 | Hartford-East Hartford, CT Combined Statistical Area | 1466482 | 1486436 | -1.3% | -0.1% |
| 137 | Rochester-Batavia-Seneca Falls, NY Combined Statistical Area | 1158471 | 1175001 | -1.4% | -0.1% |
| 138 | Cleveland-Akron-Canton, OH Combined Statistical Area | 3577606 | 3630166 | -1.5% | -0.1% |
| 139 | Clovis-Portales, NM Combined Statistical Area | 67143 | 68222 | -1.6% | -0.2% |
| 140 | Toledo-Findlay-Tiffin, OH Combined Statistical Area | 830245 | 843900 | -1.6% | -0.2% |
| 141 | Ithaca-Cortland, NY Combined Statistical Area | 148231 | 150900 | -1.8% | -0.2% |
| 142 | Lima-Van Wert-Celina, OH Combined Statistical Area | 217093 | 221838 | -2.1% | -0.2% |
| 143 | Shreveport-Bossier City-Minden, LA Combined Statistical Area | 430347 | 439811 | -2.2% | -0.2% |
| 144 | Paducah-Mayfield, KY-IL Combined Statistical Area | 132908 | 135883 | -2.2% | -0.2% |
| 145 | Monroe-Ruston, LA Combined Statistical Area | 245388 | 251155 | -2.3% | -0.2% |
| 146 | DeRidder-Fort Polk South, LA Combined Statistical Area | 85775 | 87988 | -2.5% | -0.3% |
| 147 | Quincy-Hannibal, IL-MO Combined Statistical Area | 113315 | 116262 | -2.5% | -0.3% |
| 148 | Pittsburgh-New Castle-Weirton, PA-OH-WV Combined Statistical Area | 2593177 | 2660727 | -2.5% | -0.3% |
| 149 | Montgomery-Selma-Alexander City, AL Combined Statistical Area | 459464 | 471511 | -2.6% | -0.3% |
| 150 | Mansfield-Ashland-Bucyrus, OH Combined Statistical Area | 215591 | 221398 | -2.6% | -0.3% |
| 151 | Bloomsburg-Berwick-Sunbury, PA Combined Statistical Area | 257753 | 264739 | -2.6% | -0.3% |
| 152 | Mount Pleasant-Alma, MI Combined Statistical Area | 109787 | 112787 | -2.7% | -0.3% |
| 153 | Williamsport-Lock Haven, PA Combined Statistical Area | 151166 | 155349 | -2.7% | -0.3% |
| 154 | Syracuse-Auburn, NY Combined Statistical Area | 722067 | 742603 | -2.8% | -0.3% |
| 155 | Columbus-West Point, MS Combined Statistical Area | 77661 | 80413 | -3.4% | -0.3% |
| 156 | Springfield-Jacksonville-Lincoln, IL Combined Statistical Area | 304758 | 316177 | -3.6% | -0.4% |
| 157 | Parkersburg-Marietta-Vienna, WV-OH Combined Statistical Area | 148295 | 154451 | -4.0% | -0.4% |
| 158 | Saginaw-Midland-Bay City, MI Combined Statistical Area | 375696 | 391569 | -4.1% | -0.4% |
| 159 | Marinette-Iron Mountain, WI-MI Combined Statistical Area | 92280 | 96369 | -4.2% | -0.4% |
| 160 | Altoona-Huntingdon, PA Combined Statistical Area | 165597 | 173002 | -4.3% | -0.4% |
| 161 | Rocky Mount-Wilson-Roanoke Rapids, NC Combined Statistical Area | 296234 | 310416 | -4.6% | -0.5% |
| 162 | Erie-Meadville, PA Combined Statistical Area | 352123 | 369331 | -4.7% | -0.5% |
| 163 | Richmond-Connersville, IN Combined Statistical Area | 88670 | 93194 | -4.9% | -0.5% |
| 164 | Rockford-Freeport-Rochelle, IL Combined Statistical Area | 428209 | 450639 | -5.0% | -0.5% |
| 165 | Martin-Union City, TN Combined Statistical Area | 63465 | 66828 | -5.0% | -0.5% |
| 166 | Elmira-Corning, NY Combined Statistical Area | 177279 | 187820 | -5.6% | -0.6% |
| 167 | Youngstown-Warren, OH-PA Combined Statistical Area | 632538 | 673614 | -6.1% | -0.6% |
| 168 | Burlington-Fort Madison-Keokuk, IA-IL-MO Combined Statistical Area | 102975 | 109761 | -6.2% | -0.6% |
| 169 | Charleston-Huntington-Ashland, WV-OH-KY Combined Statistical Area | 770402 | 823417 | -6.4% | -0.7% |
| 170 | Dixon-Sterling, IL Combined Statistical Area | 88303 | 94529 | -6.6% | -0.7% |
| 171 | Johnstown-Somerset, PA Combined Statistical Area | 201588 | 221421 | -9.0% | -0.9% |
| 172 | Cleveland-Indianola, MS Combined Statistical Area | 54882 | 63595 | -13.7% | -1.5% |
| Tweet |
| |
| Click here to share this on BiggerPockets.com! | ||