Can we spot trends in residential real estate prices?
Introduction
I came across the assertion that "Memphis is a flat market" while reading the biggerpockets forum. Memphis TN still has a lot of properties listed around $100,000.
This contrasts with markets such as Phoenix or Las Vegas made headlines for 50% drop in prices followed by a substantial increase. It stands to reason that a market that still has houses priced at $100,000 must be somehow a less volatile market than one where house prices can rise to $300,000.
Fortunately, zillow home values can help bring some factual information into a discussion dominated by catchy headlines and presumptive opinions.
National Home Price Information
The USA is a union of very diverse states. Trulia shows a price heatmap that gives a spatial distribution of US house prices. To define the temporal distribution of prices, a median or average over a certain area is required. This comes with the caveat that one can only ever invest in a given house, not in a hypothetical median US home that could be in Wisconsin one year, and in Florida three years later. Zillow home price shows a US Home Index along with other indicators. Though it is the result of much averaging, this gives a good baseline to understand price evolution.
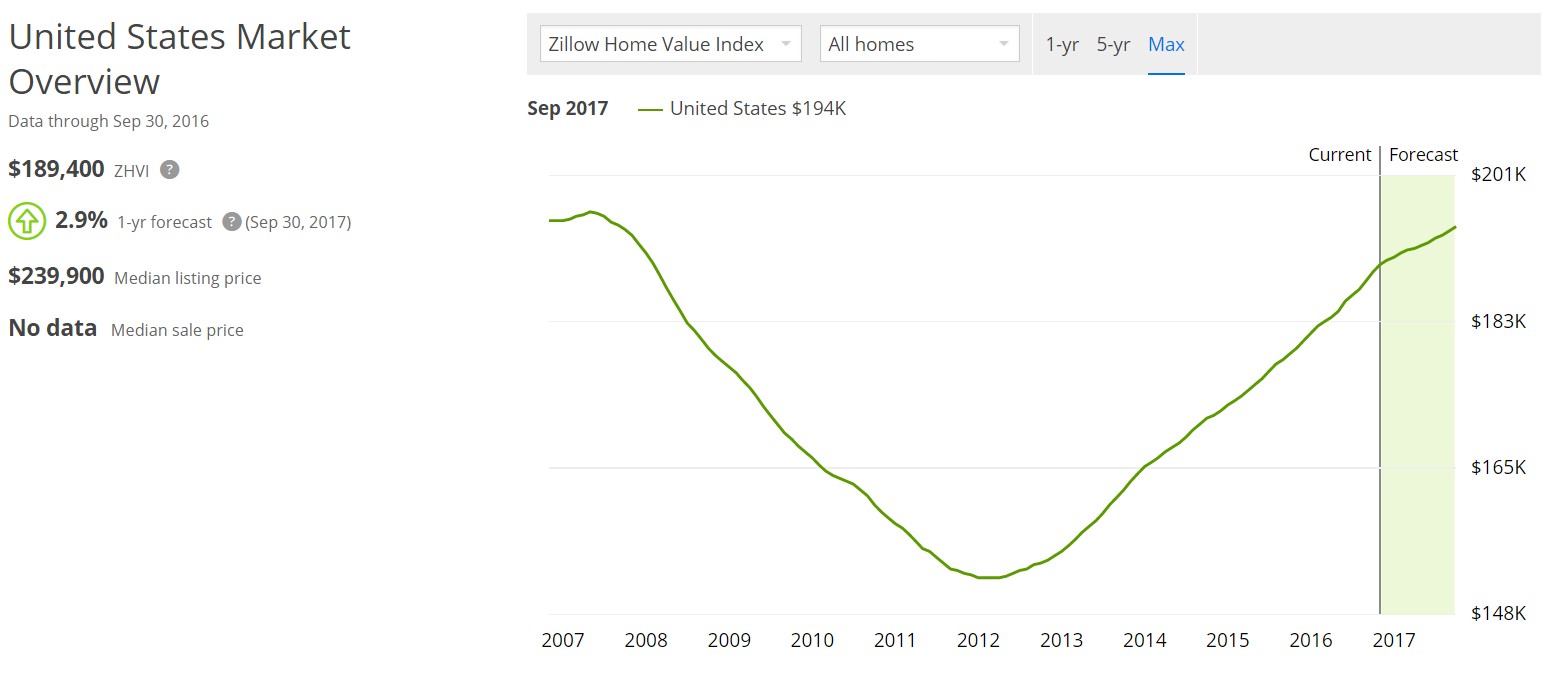
US Home Prices
The following graph illustrates the prolonged fall in house prices in the 4 years following the financial crisis and subsequent recovery of house prices after 2012.
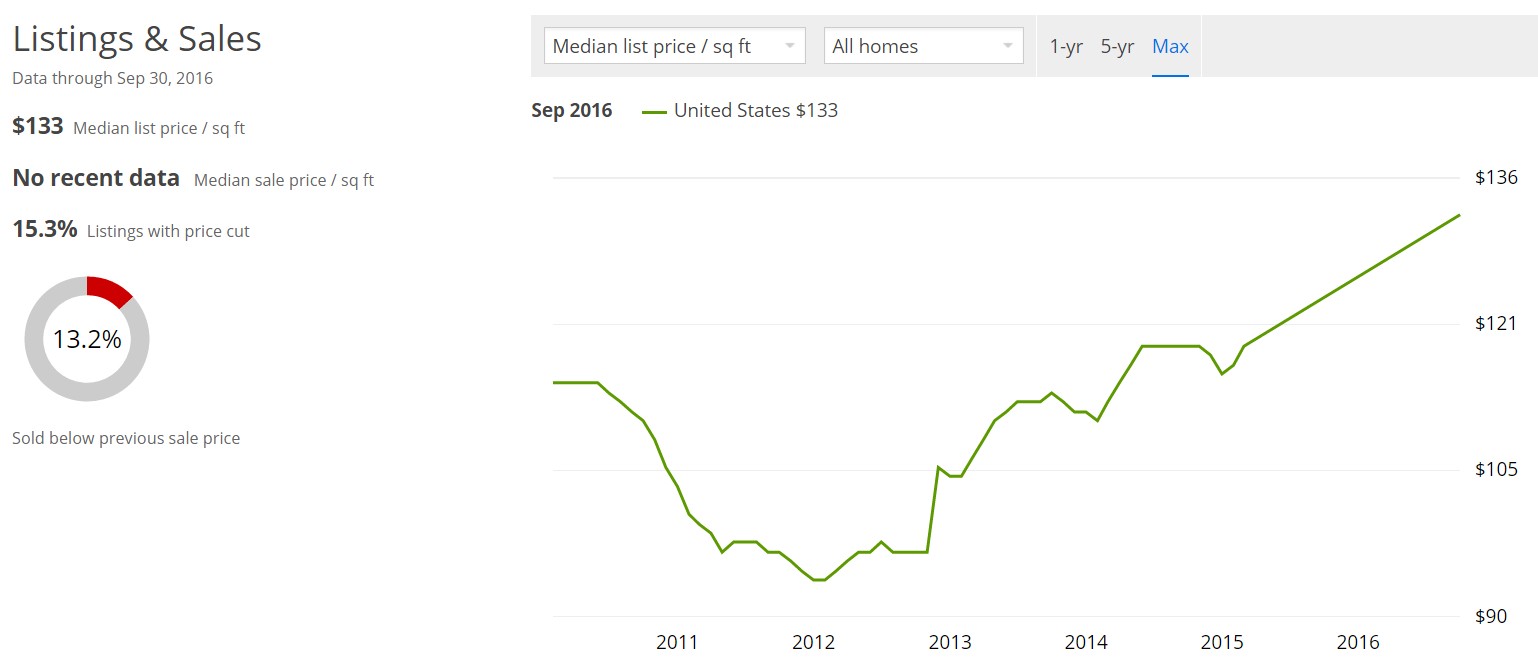
Price Per Sqft
The price per square feet paints a similar picture and is supposed to correct for effects such as smaller houses or bigger homes being sold. However, the data is only available since 2010 and there are data quality issues in 2014-2016.
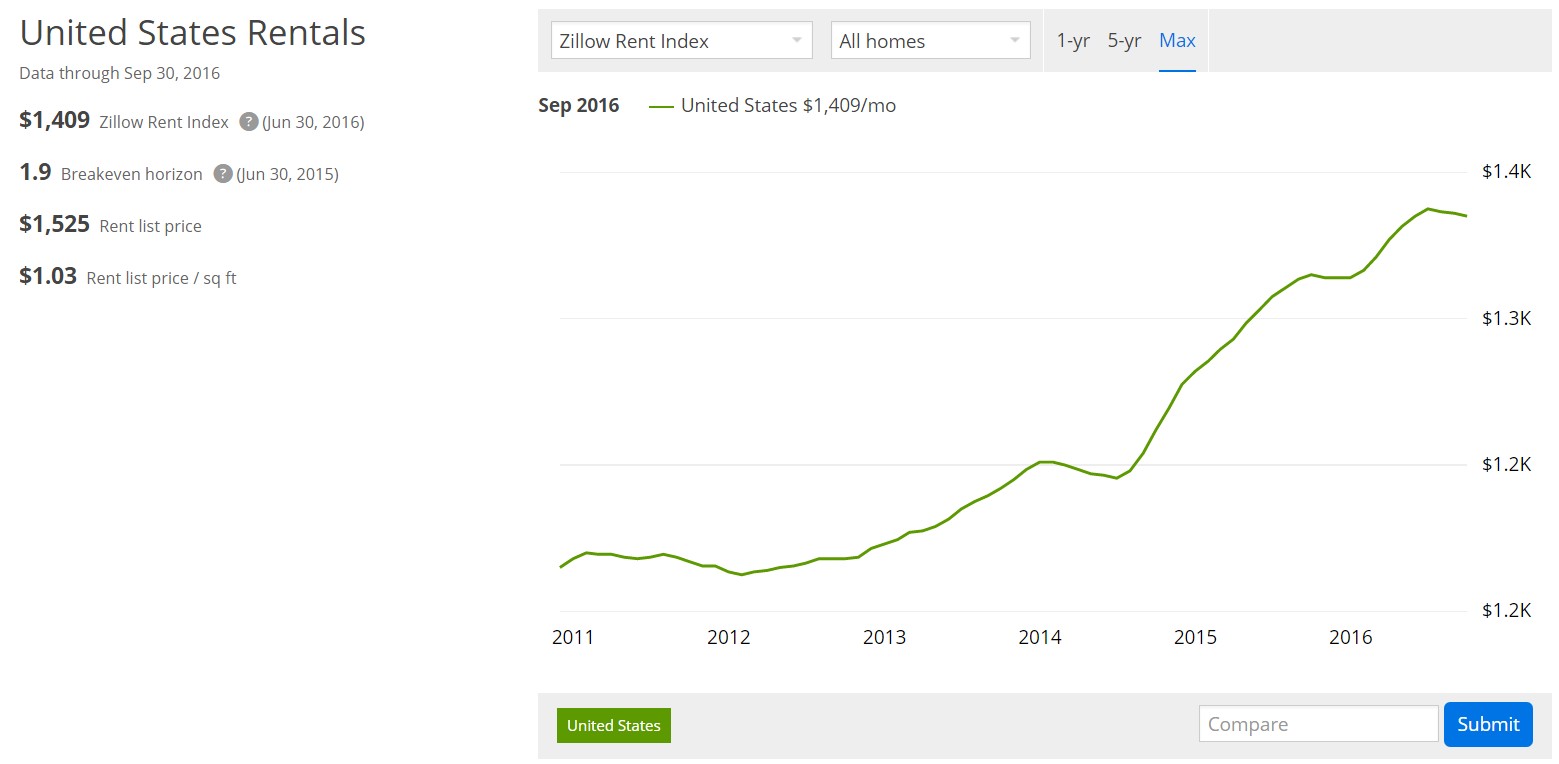
Rent Index
The rent index shows an interesting trend: the median rent in the US is increasing, which could mean either that there is a dearth of residential units available for rental, or that renting vs home ownership is being extended to higher strata of the US population. This looks in any case like good news for landlords though one would need to see how rental yields are actually increasing.
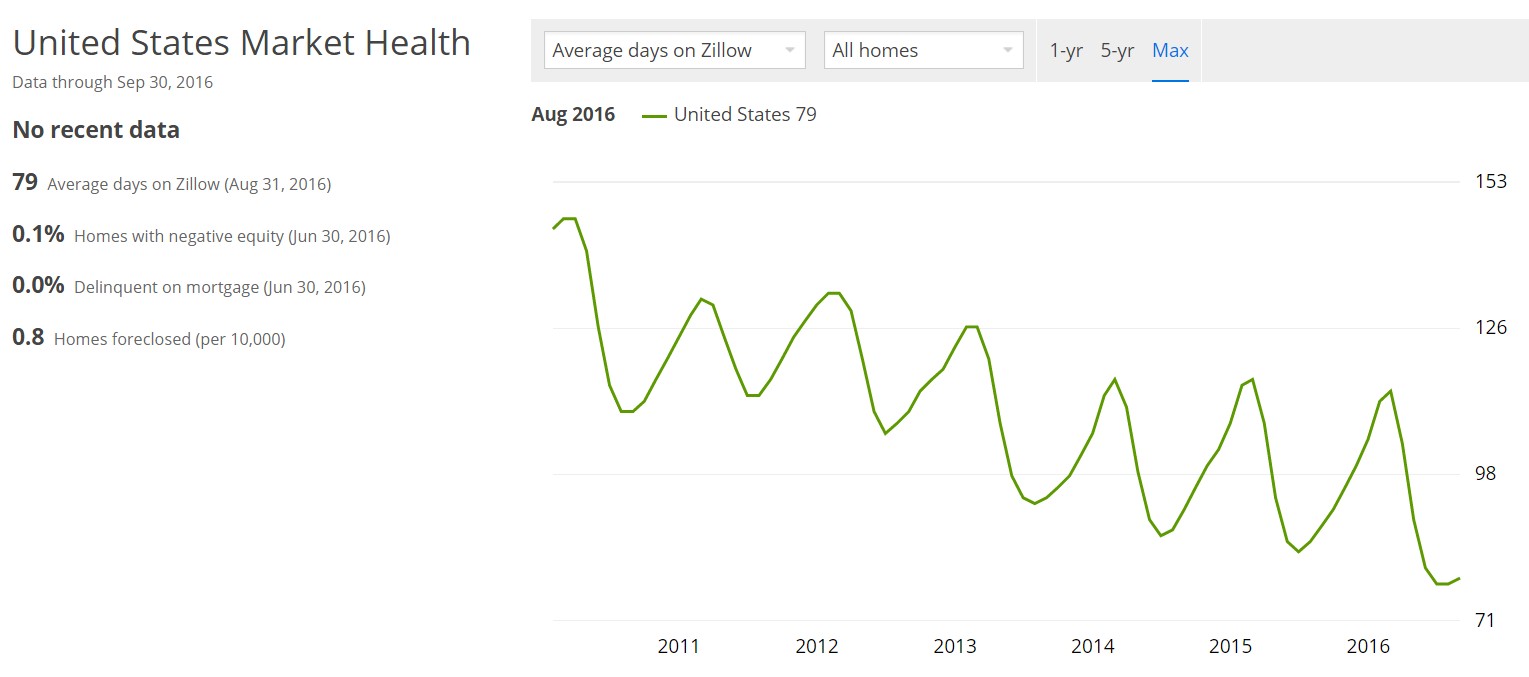
Market Health and Seasonality of House Sales
The residential real estate market is seasonal, as shown clearly by the time it takes to sell a property. People do not want to move in winter, and house sales are much harder in this period. One also sees a multi-year trend since 2010, showing that it takes less time on average to sell a house now. This is a sign of a healthier housing market. As long time to sell and lower transaction volumes are a sign of seller being unable to sell his house at the desired price.
News headlines are often based on newly released monthly data. Such short-term observations make for frequent reporting of dramatic annualized price changes in either direction. However, we saw that monthly data need to be deseasonalized and this procedure can introduce further statistical noise. Short-term changes are far too noisy to draw any conclusion.
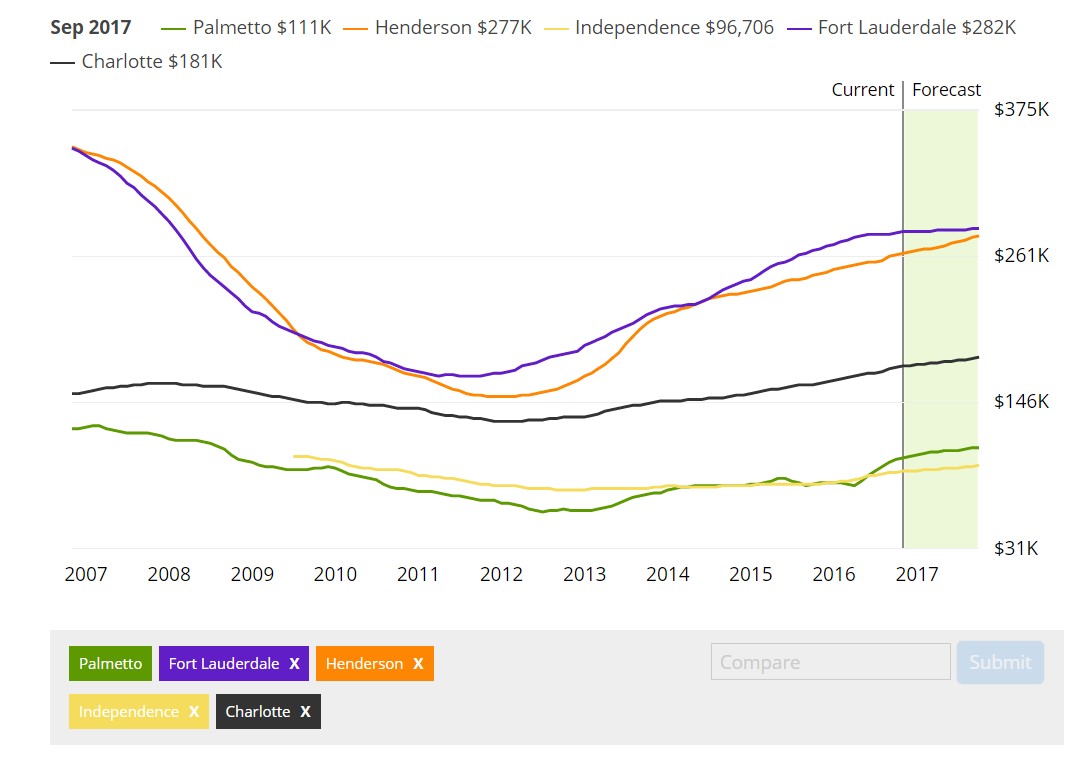
Comparison of City Zillow Home Value
I show here price comparison between
- Henderson NV (near Las Vegas) and Fort Lauderdale FL (on the east coast of the state)
- Charlotte NC
- Independence MO (near Kansas City) and Palmetto GA (near Atlanta)
Nevada and Florida are indeed hot an temperamental markets, whereas Charlotte and others seem to be a much flatter market.
Medium term, Long Term and Secular Real Estate Trend
Zillow was founded in 2006. We a see two clear trends, downwards and upwards, each lasting 5Y in the Zillow index since its creation. We need to check data prior to that to assess prior trends.
Data before Zillow: Schiller long-term house index
Nobel price Robert Schiller has produced a long-term house price index:
One observes a very strong trend starting in the mid-90s. This very hot market corresponds to the period where US mortgage rates went down. When put in historical perspective, the peak achieved in 2006 appears nothing short of hysterical.
The presence of several long-term bumps in house prices has been named the 18Y property cycle. Such cycles existed in the 19th century and from the 70s onward.

Despite these 18 year cycles, it would appear that for the US as a whole and on a 100 year period, the house real prices (i.e., inflation-adjusted) have remained stable compared to stocks. That's with the exception of the hysterical price rise caused by the generational lowering of the rates from 12% to 4% from 92 to 2005.
To analyze secular changes in prices, one may compare cities with a secular demographic deficit (Chicago) from those with a secular population increase (Atlanta). Schiller provides such data set but we will not have time to look into these.
Round trip costs prevent short-term trend arbitrage
The trend exhibited by house prices at the national level is remarkably smooth. Such a trending behavior would be arbitraged away on the stock market. For the real estate market, closing cost average 1% to 2% of house price and estate agent commission is around 6%. This 14% round trip cost precludes trading in and out of houses quickly.
An oft-touted way to "avoid" these friction costs is to buy REITs (Real Estate Investment Trust). Those exchange-traded investments are very liquid. However, this liquidity comes with several differences. First, REITs price are more correlated to stock market indices than to real estate indices. Correlation of an investment to the stock market is something a stock investor would avoid. One should also be concerned by the long-term replication of real estate yield, as it appears that the middlemen keep such a portion of the return for themselves as to reduce the yield of the leading REITs ETF IYR to 3.36%. This is rather low compared to SFH (Single Family House) yield. Performance comes with the further risk of REITs being leveraged, a point that raised the question of total loss of investor capital during the financial crisis.
Rather than avoid an imperfect market, it would appear that investors would be rewarded handsomely if they be willing and able to embrace it.
Rationale for investment in either type of city
I see therefore two strategies for building wealth from homeownership.
- investing in houses with a good rental yield
- investing in houses that appreciate.
Rental Yield
If a house was appreciating by 10% over inflation a year, its value would be 14,000 times greater after 100 years. One imagines it would be difficult finding a tenant who would pay a rent of 4,000 times the average American salary. For this reason, it can be argued that yield from rental properties is a more reliable source of long-term income, provided that the owner has the discipline to reinvest and compound that income.
House appreciation
When I started working in France, I invested my savings in the French stock market. After a few years, I noticed that every time the US stock market would fall, the French stocks would fall as well, but any time the US market recovered, the French market did not seem to gain as much. The disparity of performance in a flat market was not noticeable, but it became more salient during crises.
Despite the short-term correlation between markets, it would appear that crashes and recoveries are the occasions for the market to separate the chaff from the wheat: every price goes down during a market crash, but not by the same amount, and not every asset recovers the same way.
To illustrate such differences between areas, I show below Zillow price comparison charts for San Jose CA, Portland OR, Seattle WA, Austin TX, Las Vegas NV, and Orlando FL.
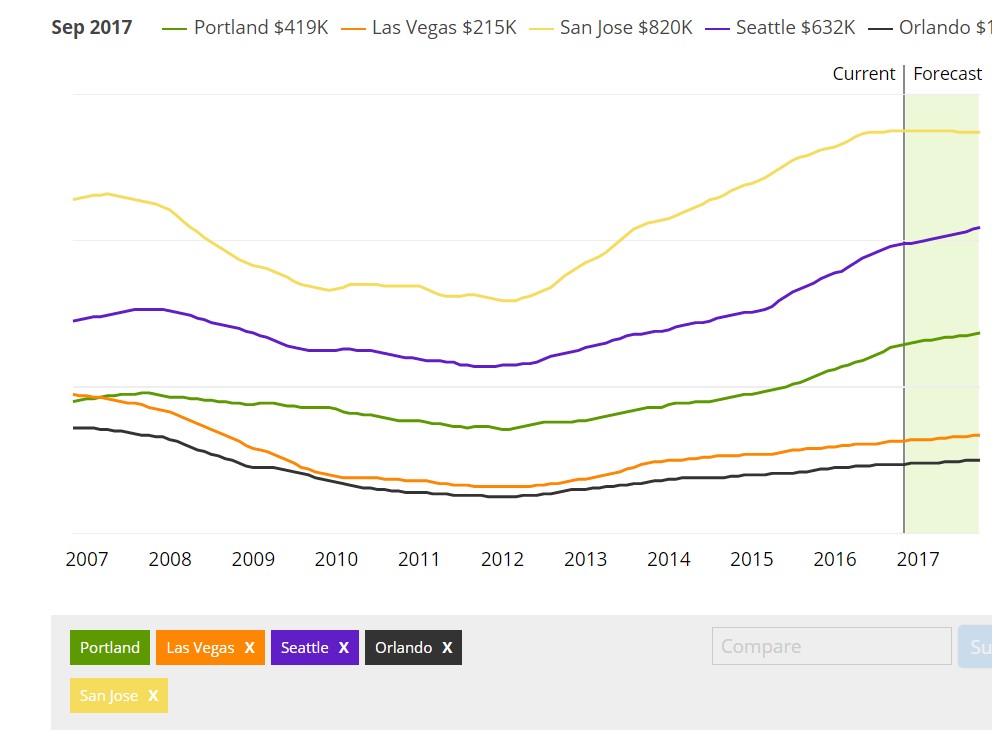
How would you interpret these graphs? Would you say that Orlando has yet to come back to its peak? Besides the fact that not all cities may have recovered to their previous peak, it is also obvious that some cities fell less. Despite having gained less in price, Portland seems to have both more upside and less downside than Orlando or Las Vegas. the Calmar ratio of the investment must be indeed quite different.
How local is a real estate market?
Of course, these are city level aggregates, one has to dig the deeper level numbers before making investments in a particular housing unit.
So, how local is the real estate market?
The generally accepted answer to this question is that it depends and it is best discussed with a local estate agent.
The subdivision, will generally have a sufficient number of transactions to allow more focused statistics than postcodes while allowing to capture local market trends.
One would, therefore, encourage anyone to check price evolution at a subdivision level and double check with a local estate agent.
(Cover Photo by Nicolette Mason/Flickr Creative Commons)
| Tweet |
| |
| Click here to share this on BiggerPockets.com! | ||