Profitability and Solvency
What drives house fundamental value
The previous made a sociological description of the varied types of home dwellers in the US and their motivation. We will now concern ourselves with real estate as an investment and review some of the fundamental drivers of home value.
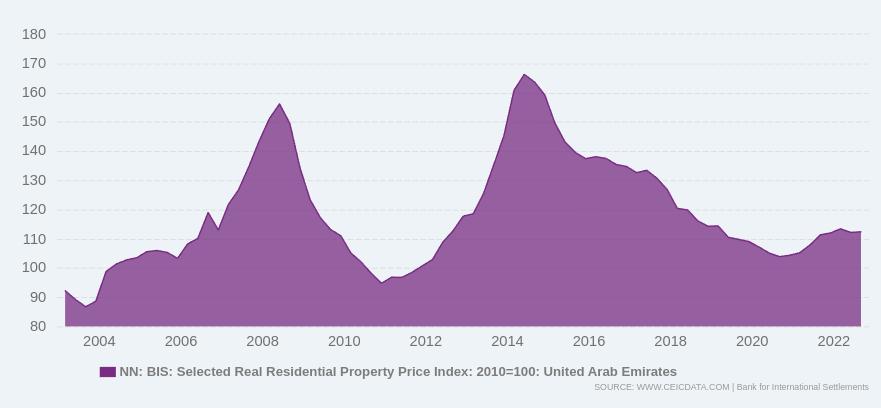
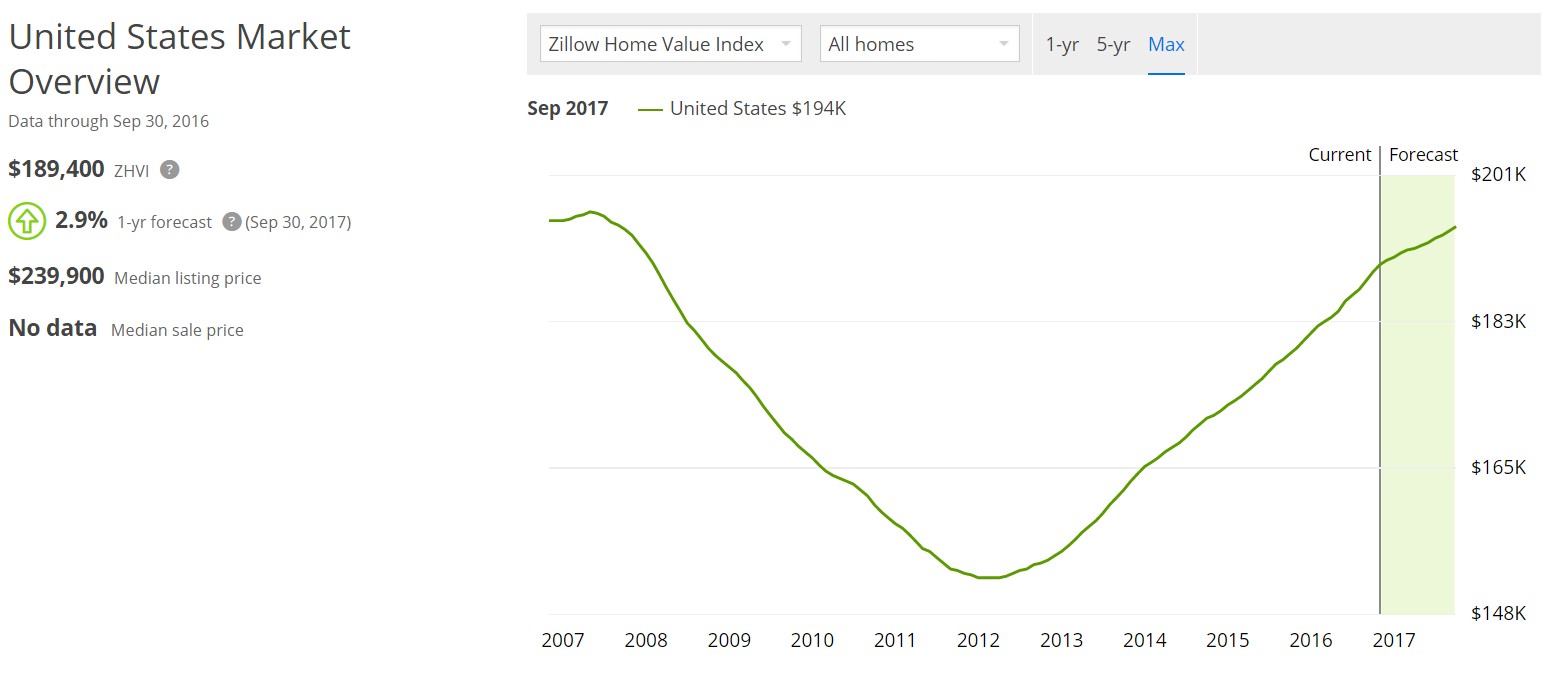
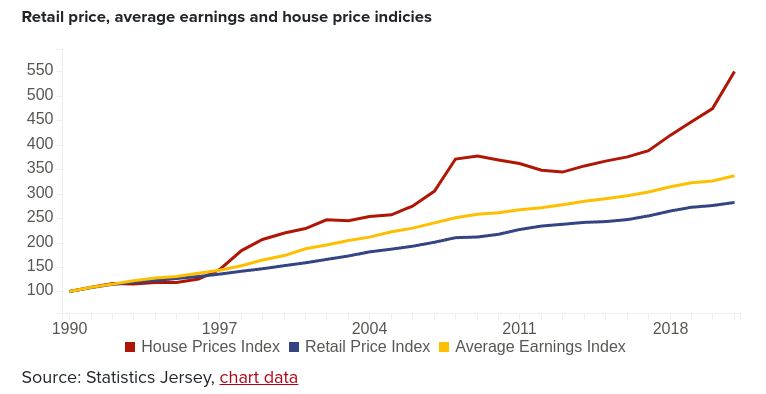
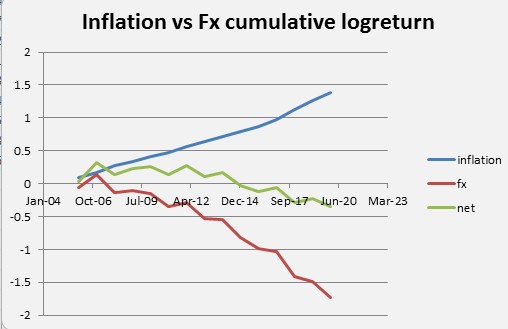
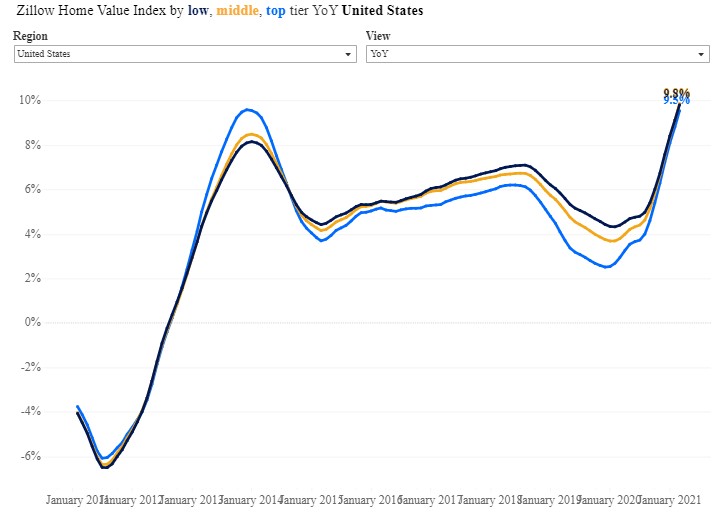
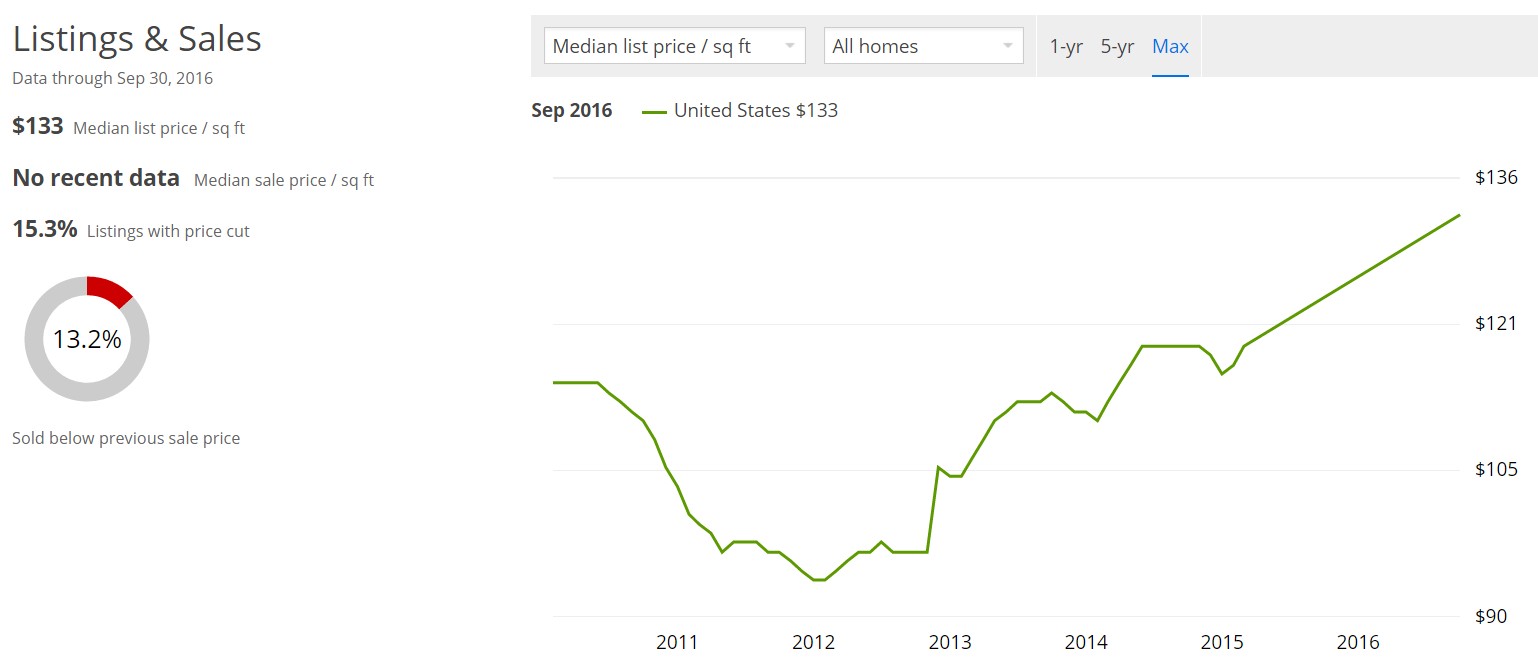
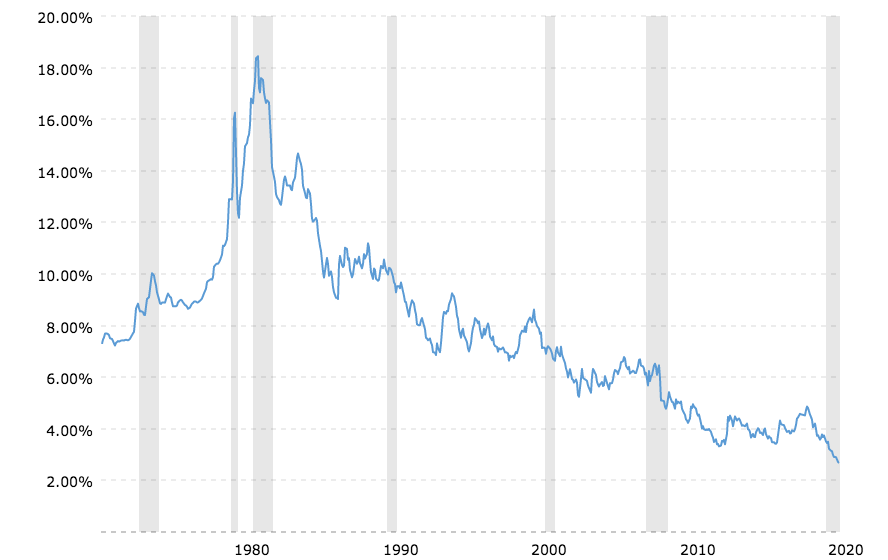
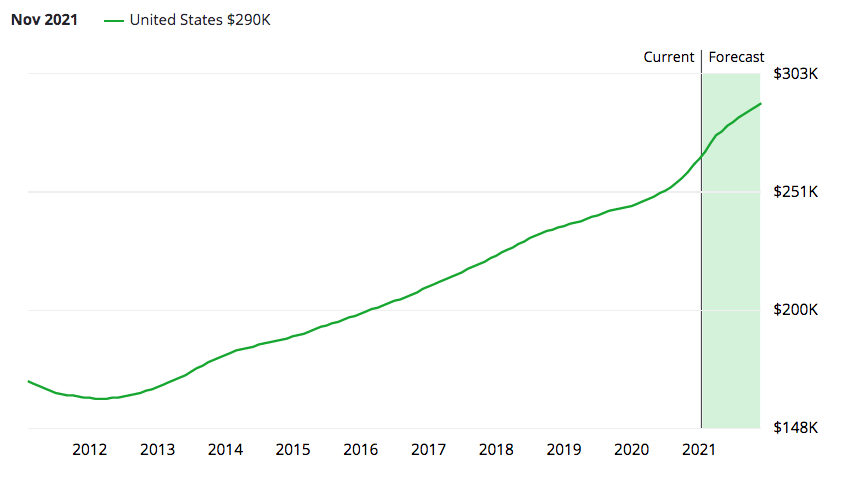
- Inflation: the Shiller study of house prices show the national level US house value in inflation-adjusted terms along with its building costs. Over the long run, house prices are stable in inflation-adjusted terms, and their value seems to follow the general level of consumer prices. Since 2000 however, we observe a decoupling between national house prices and inflation. This graph aggregates very different numbers together, as some areas have houses trading much nearer their building cost, while in others, land value is socially or speculatively enhanced. The bottom line is that one should not expect house prices to appreciate faster than inflation. This being said, owning a house instead of cash always makes sense in a context where central banks are printing money. Houses are excellent hyperinflation hedges.
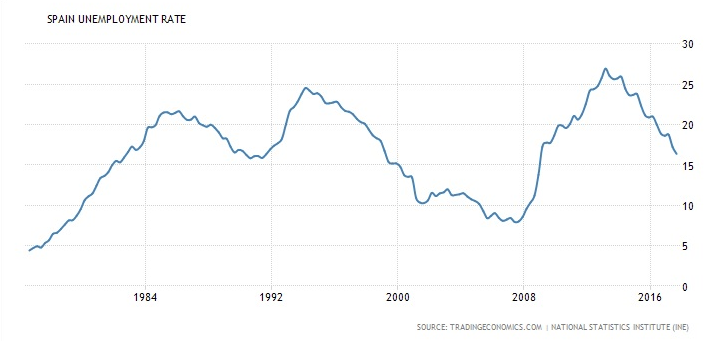
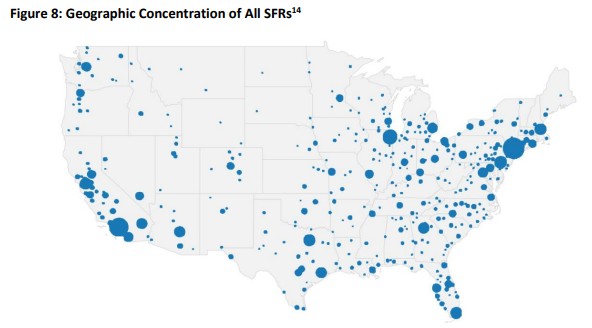
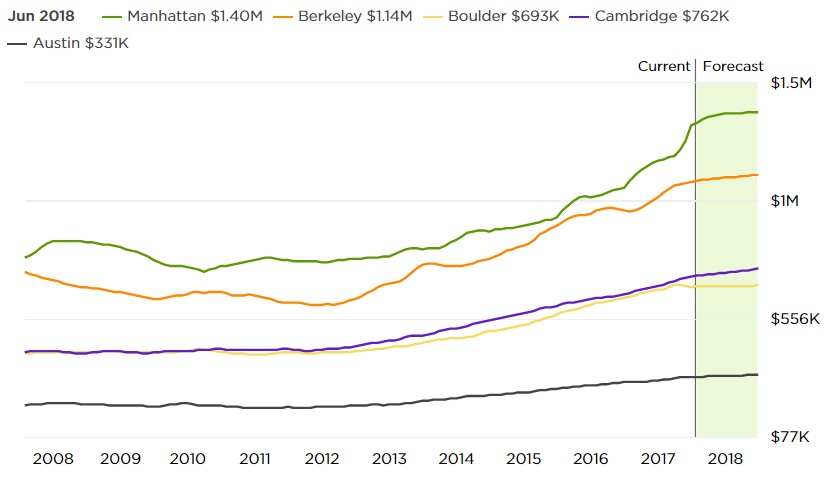
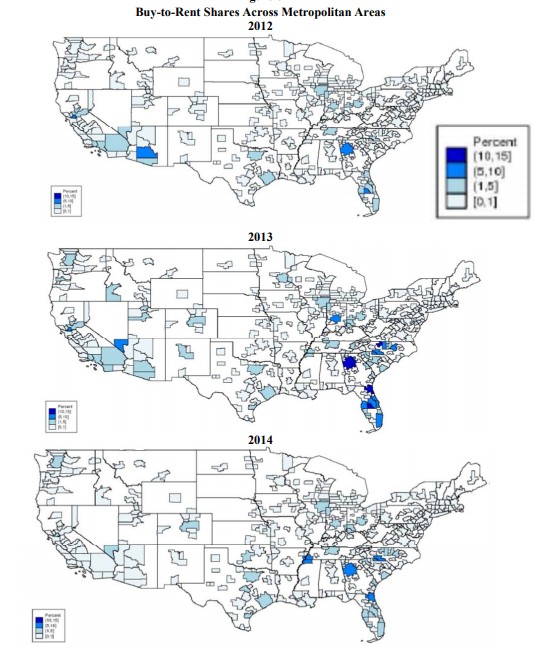
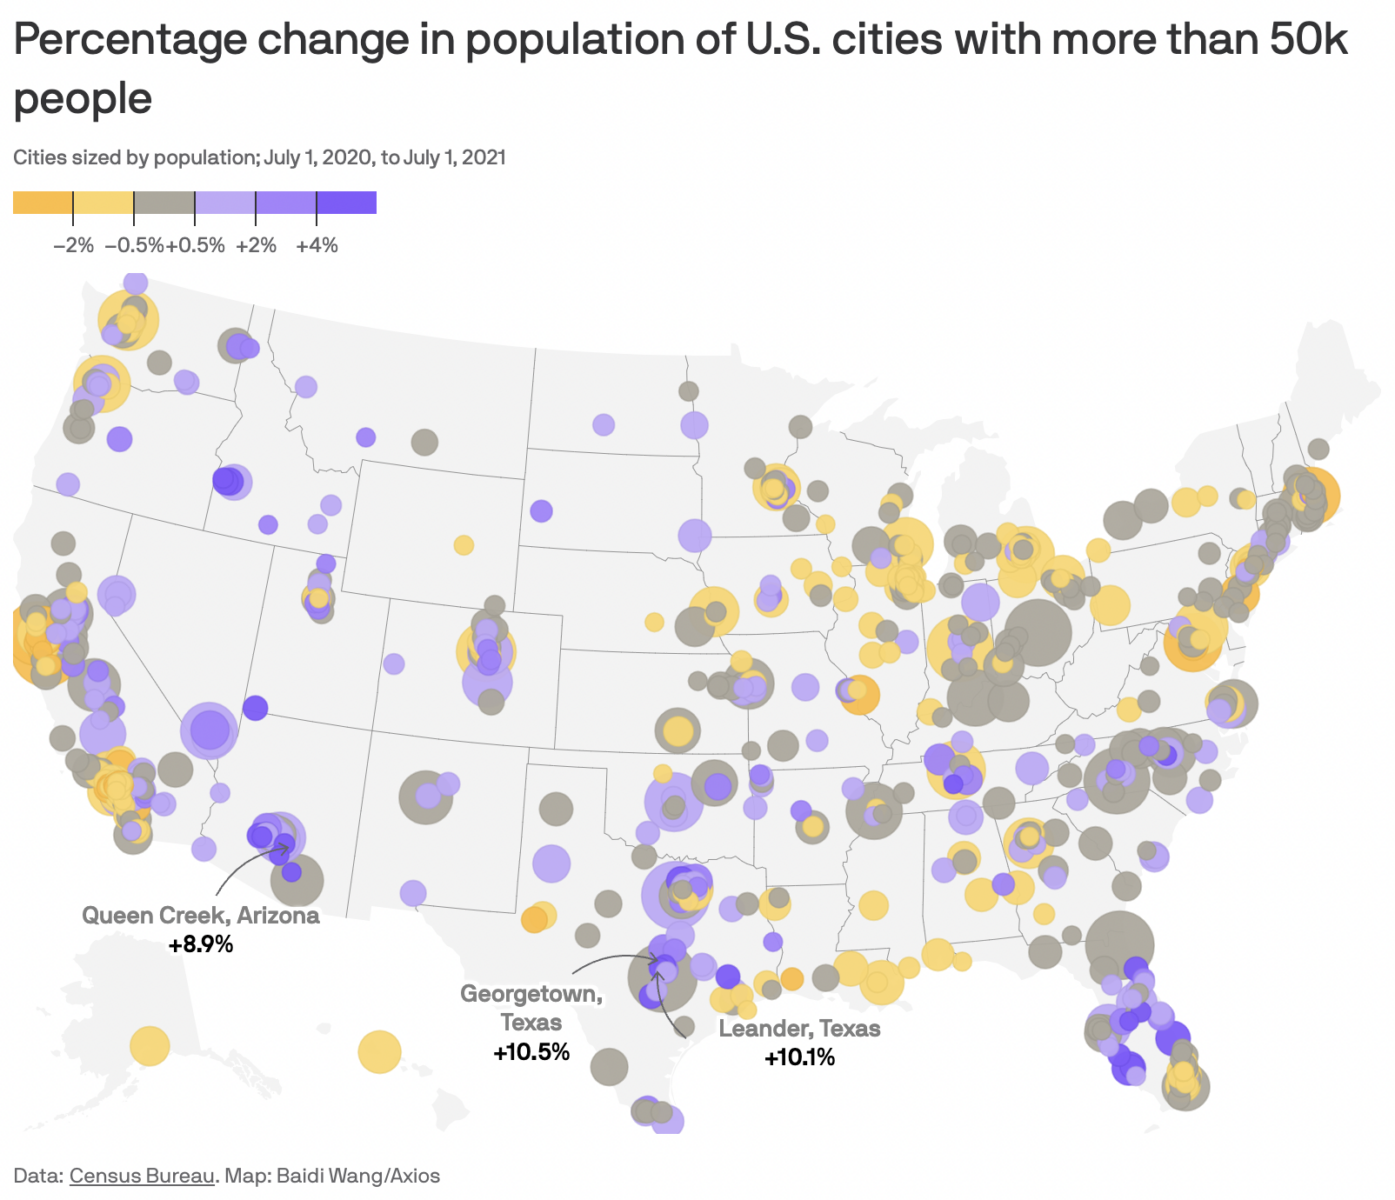
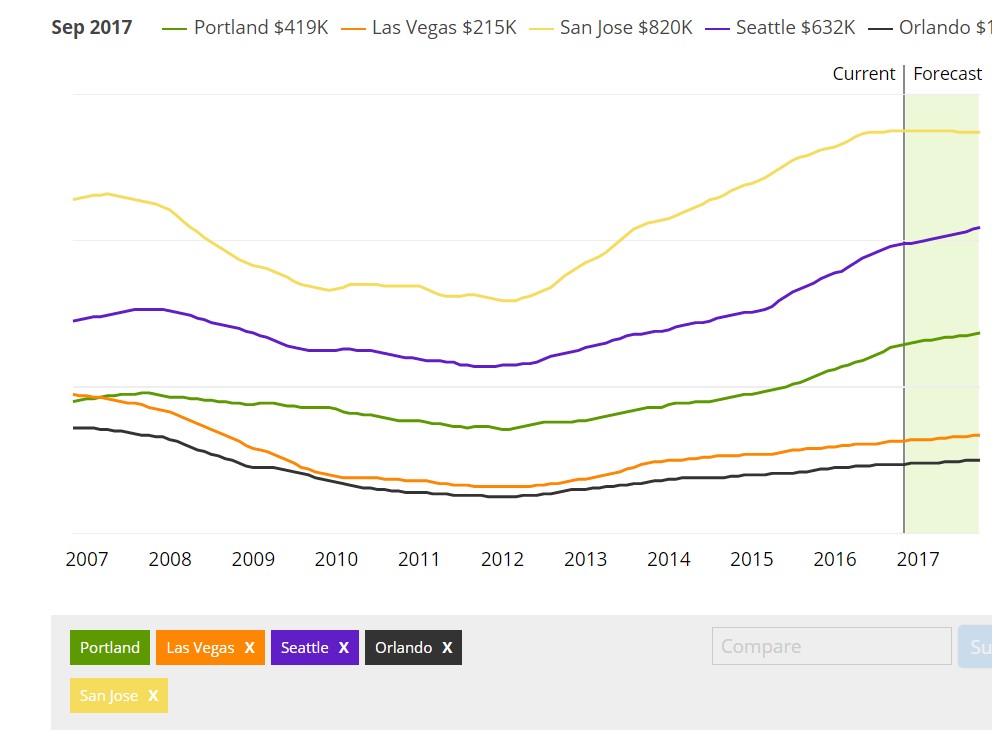
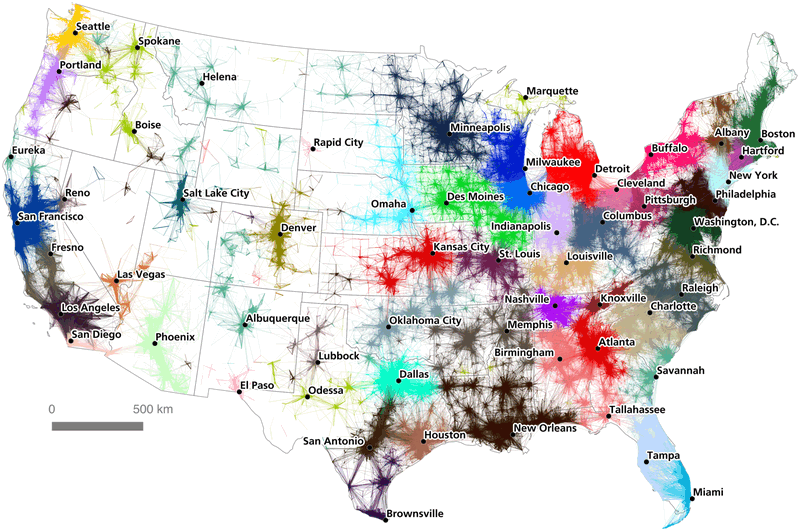
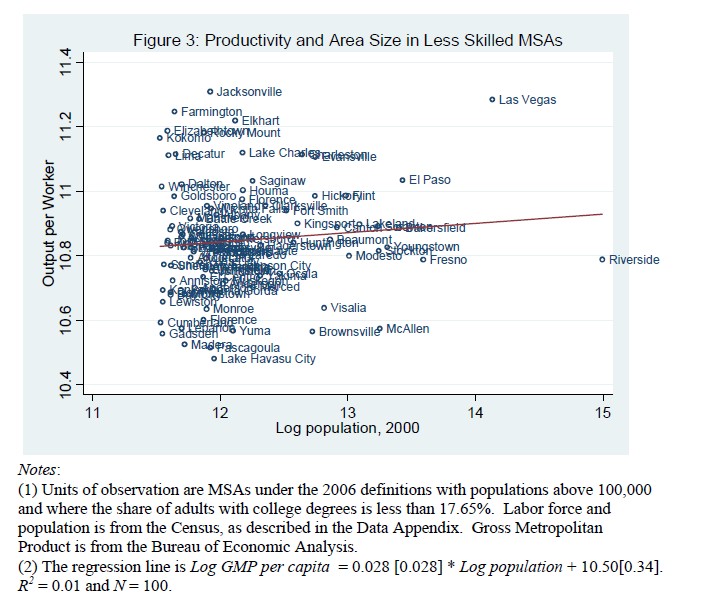
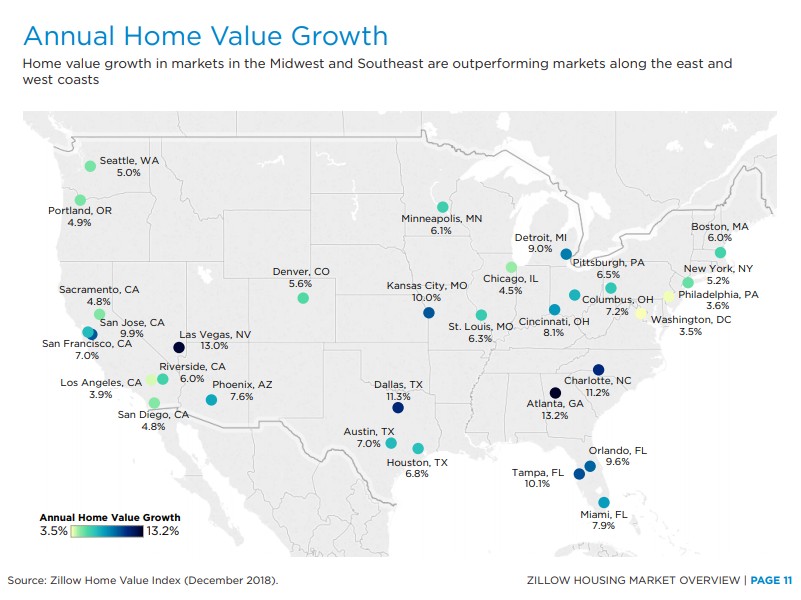
- Demographics: some areas will appreciate faster than others. Demographic changes occur over very long periods of over 30 years. For instance, the population of Chicago (IL) decreased from 3.6mln in 1950 to 2.6mln. For Detroit (MI), it went from 1.8mln in 1950 to 700k today. The population of these cities declined steadily every ten years for more than 60 years. In each of these cities, sufficient dwelling for 1mln people has become vacant; high-quality brick houses are now available below replacement cost. For house prices to rise again, the population needs to increase again so that we go from housing glut to scarcity again. Cities such as Austin TX where the population grew 15% to 40% every ten years saw much faster home value growth. You can find demographics in the Wikipedia section of any city.
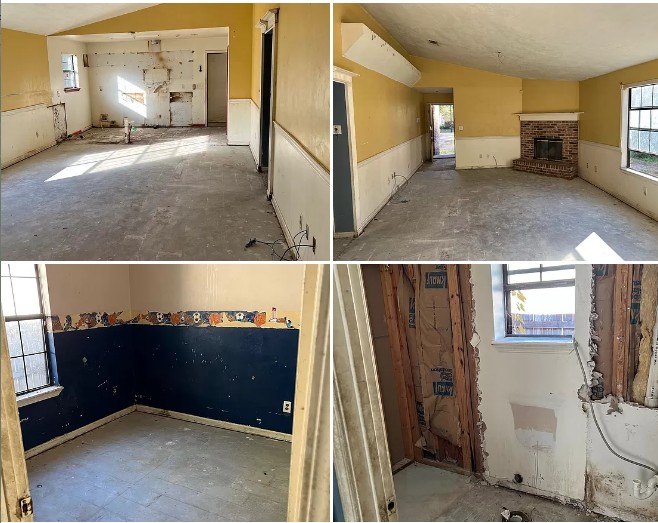
- Depreciation and costs: while long-term house prices appear to follow inflation, a house built in 1900 would need to have its plumbing updated from lead pipe to copper, electricity installed, etc. If the home has a wooden frame, the house needs to be demolished and rebuilt after some time. The taxman asks you to assume that the house value will depreciate for 27.5 years, and you should indeed expect some depreciation if you buy and hold a house in an area where the population is not increasing.
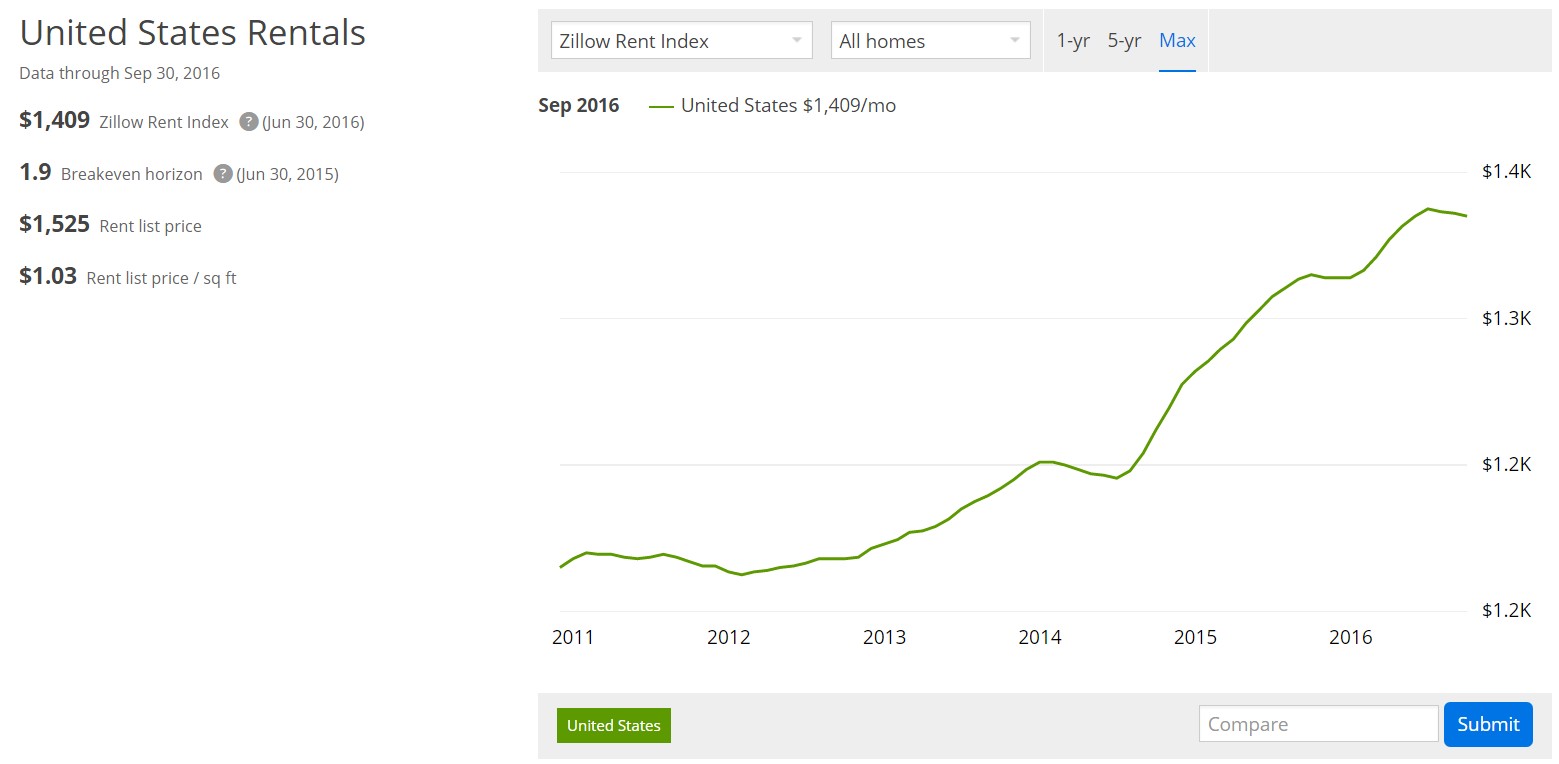
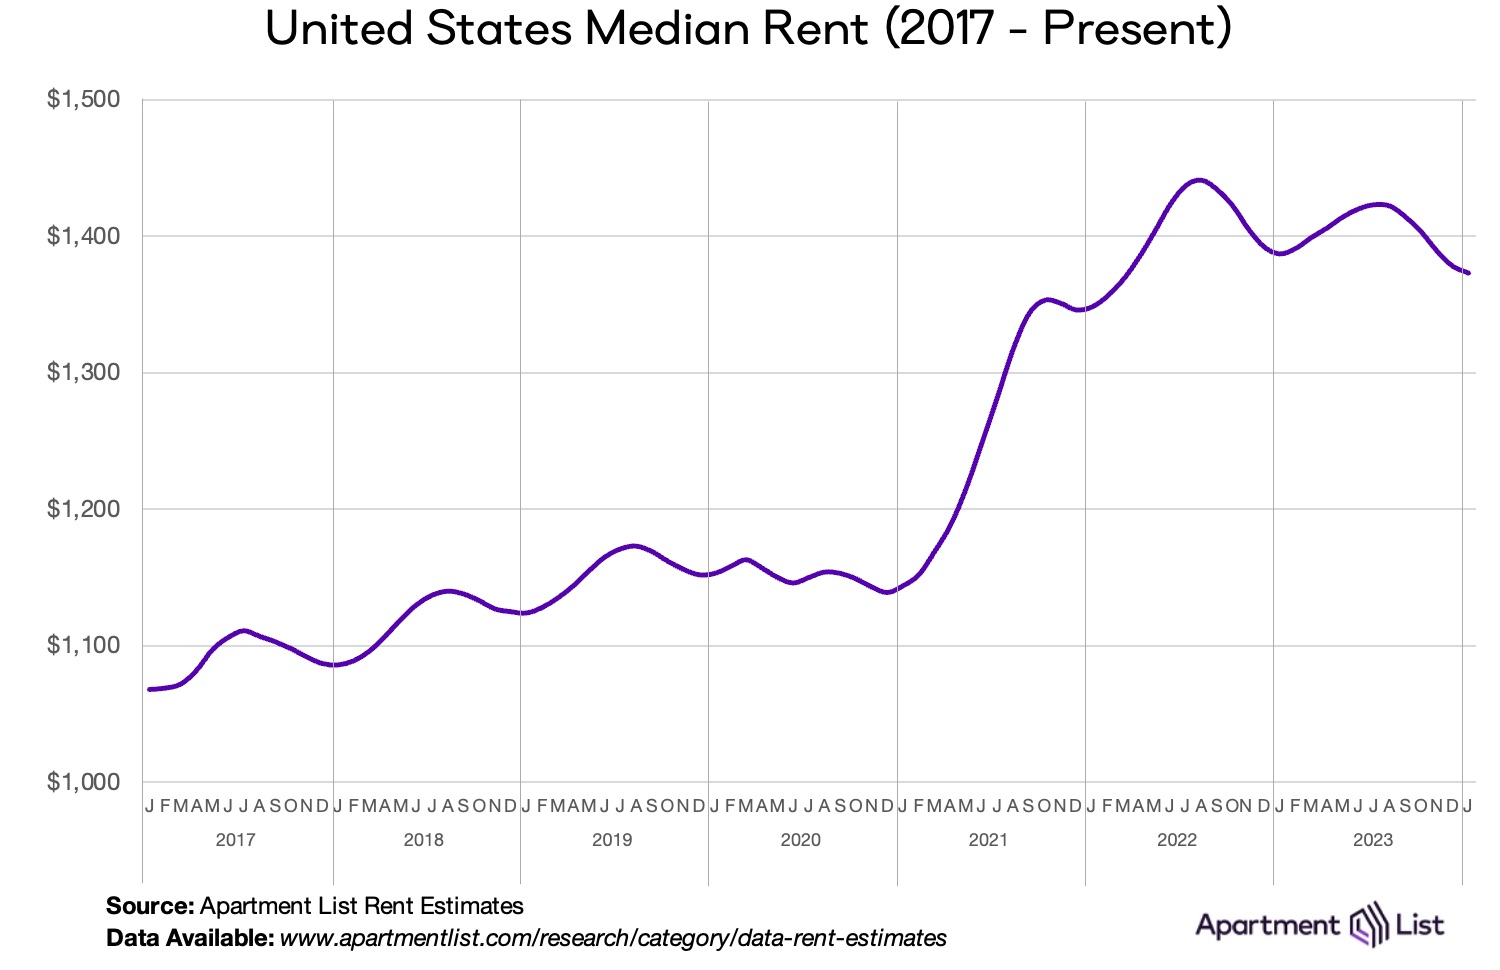
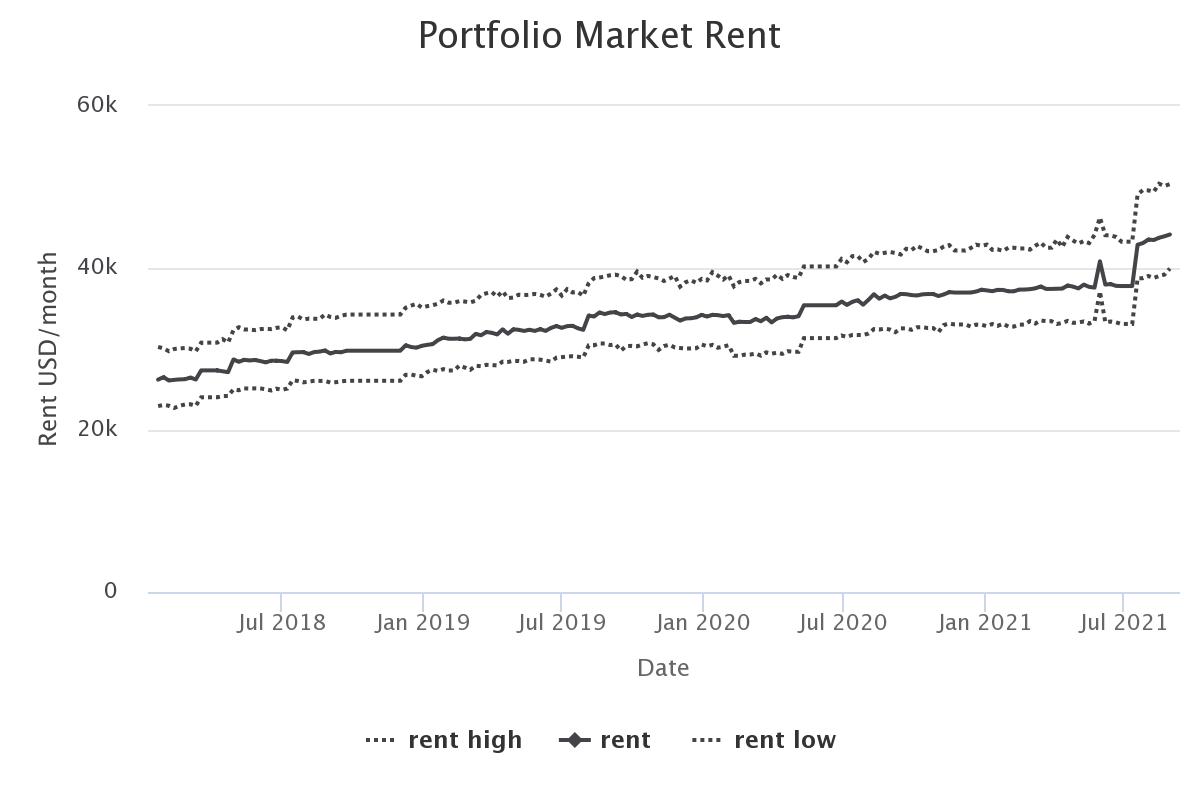
- Rent: as suggested by Shiller, purchasing an expensive home and hoping that it appreciates over time does not make sense in many locations: you cannot expect to break even with inflation if the population is stable or even worse than that if it decreases over the long term. Besides, you need to add in the cost of maintaining the house, and this may well cost you 3% to 4% per year. The game changer here is that if you receive a high rent compared to the house expenses, this effect may more than compensate the others. So buying an expensive home may be a poor investment, but buying many reasonably priced rental properties has much better economics.
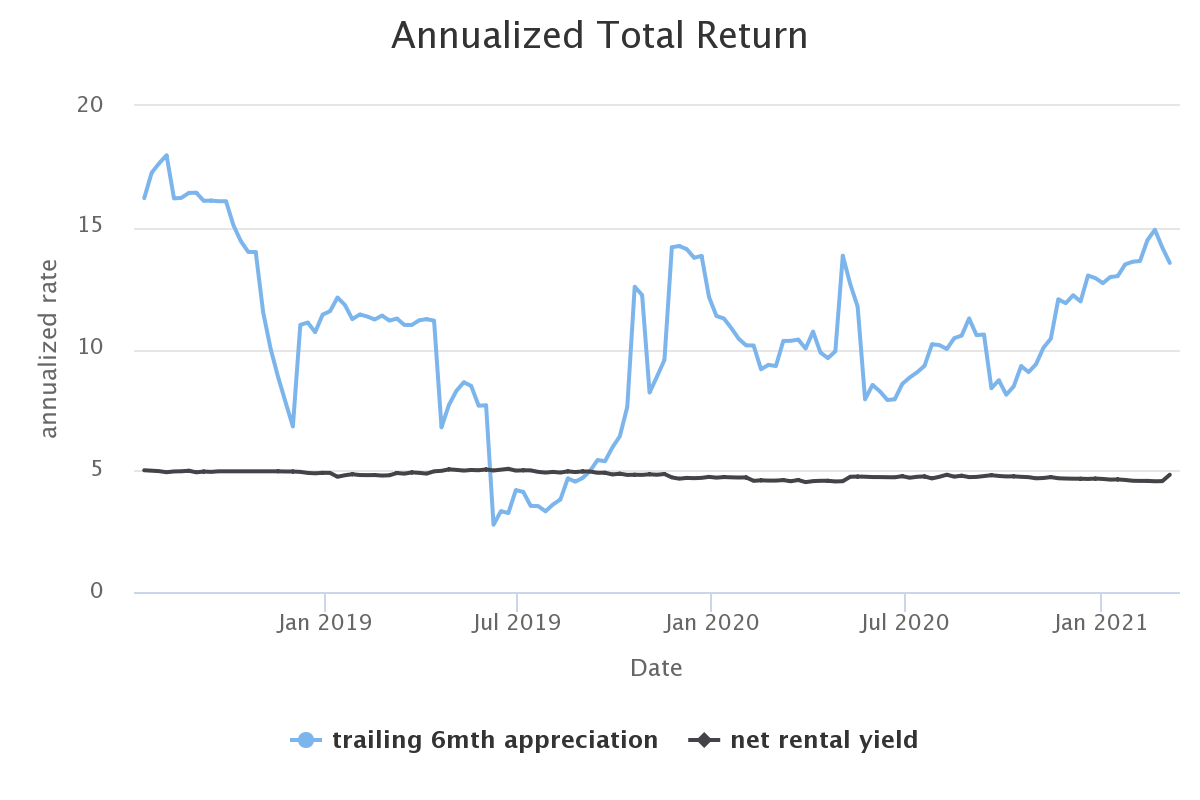
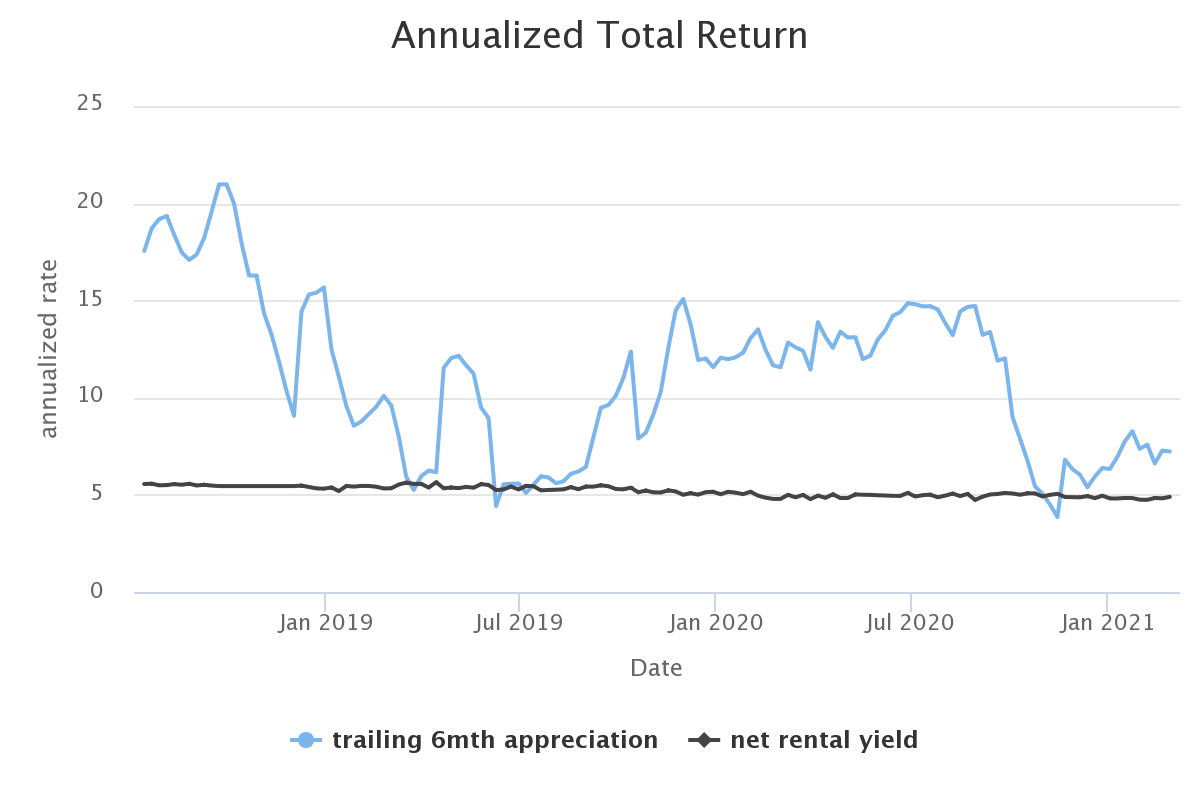
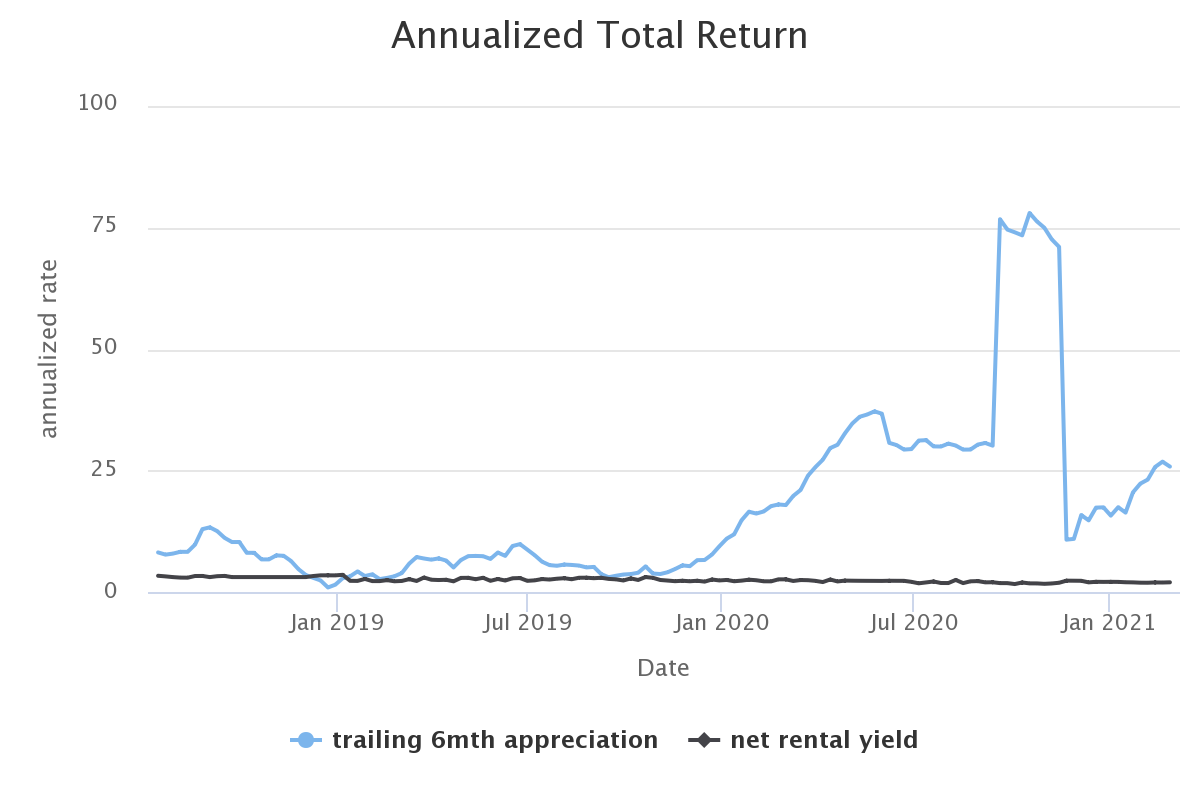
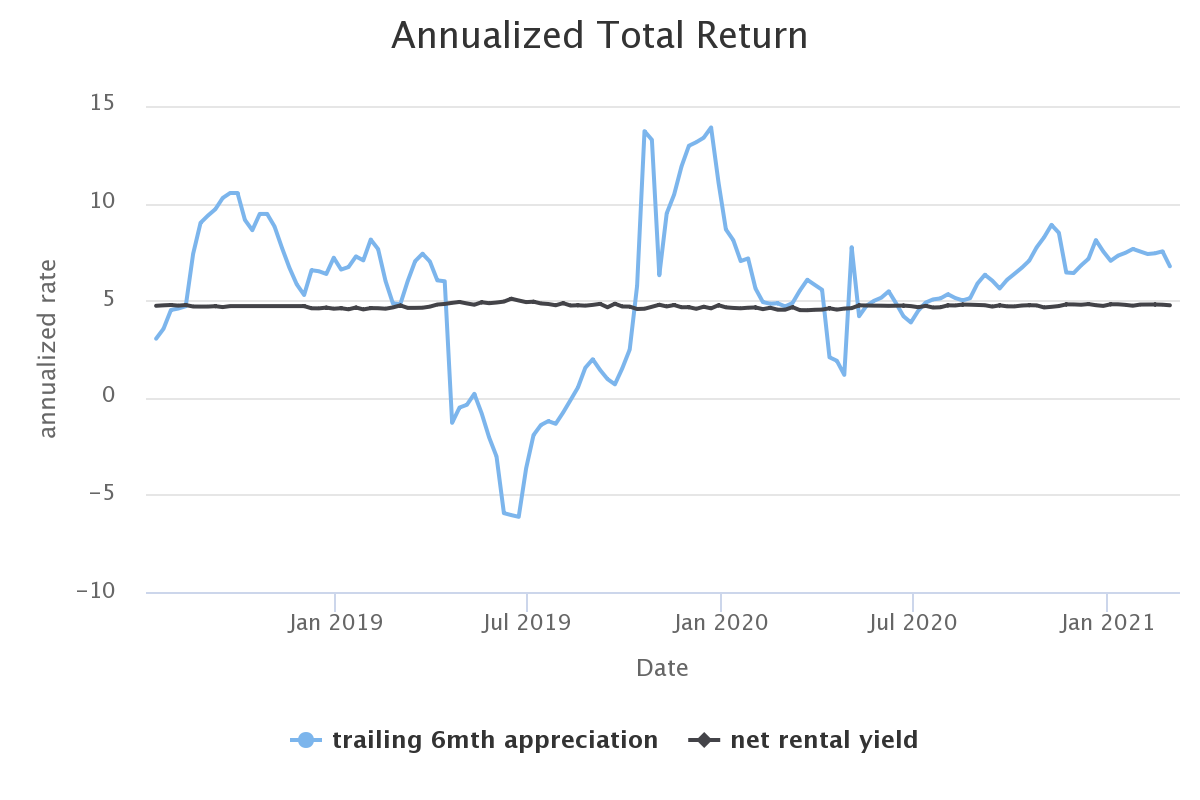
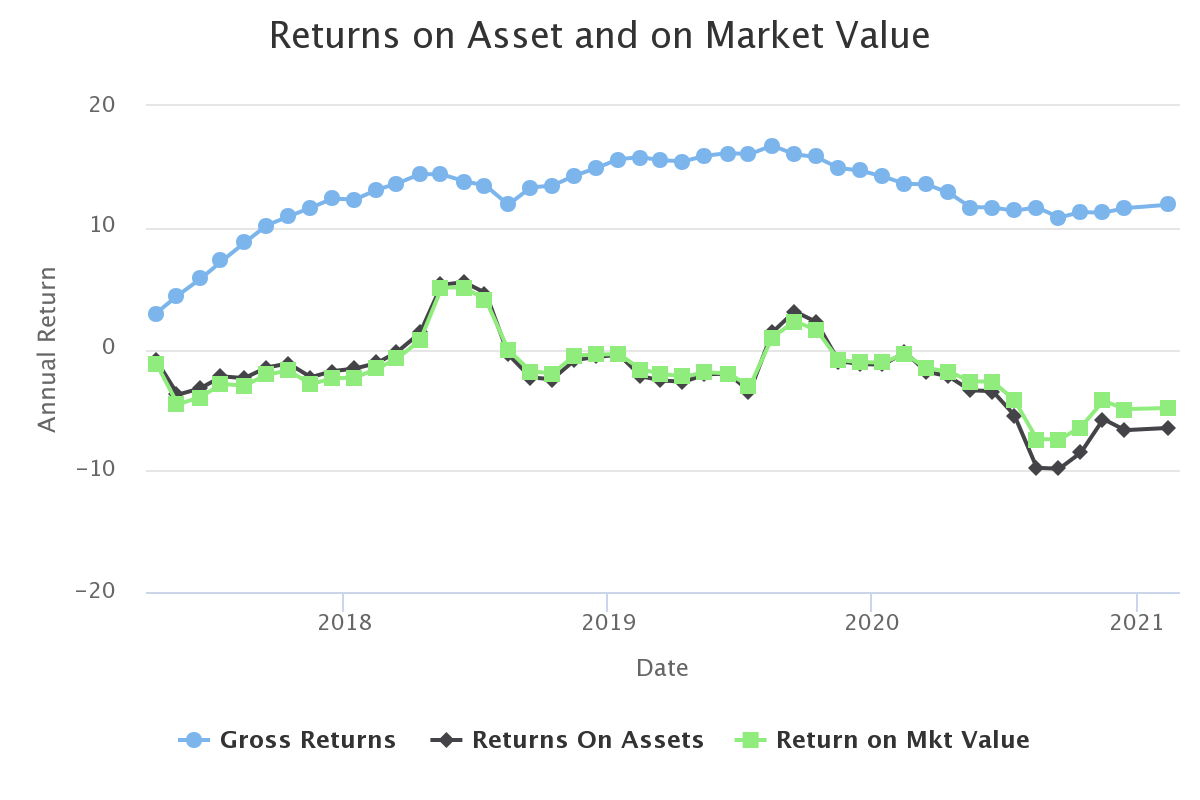
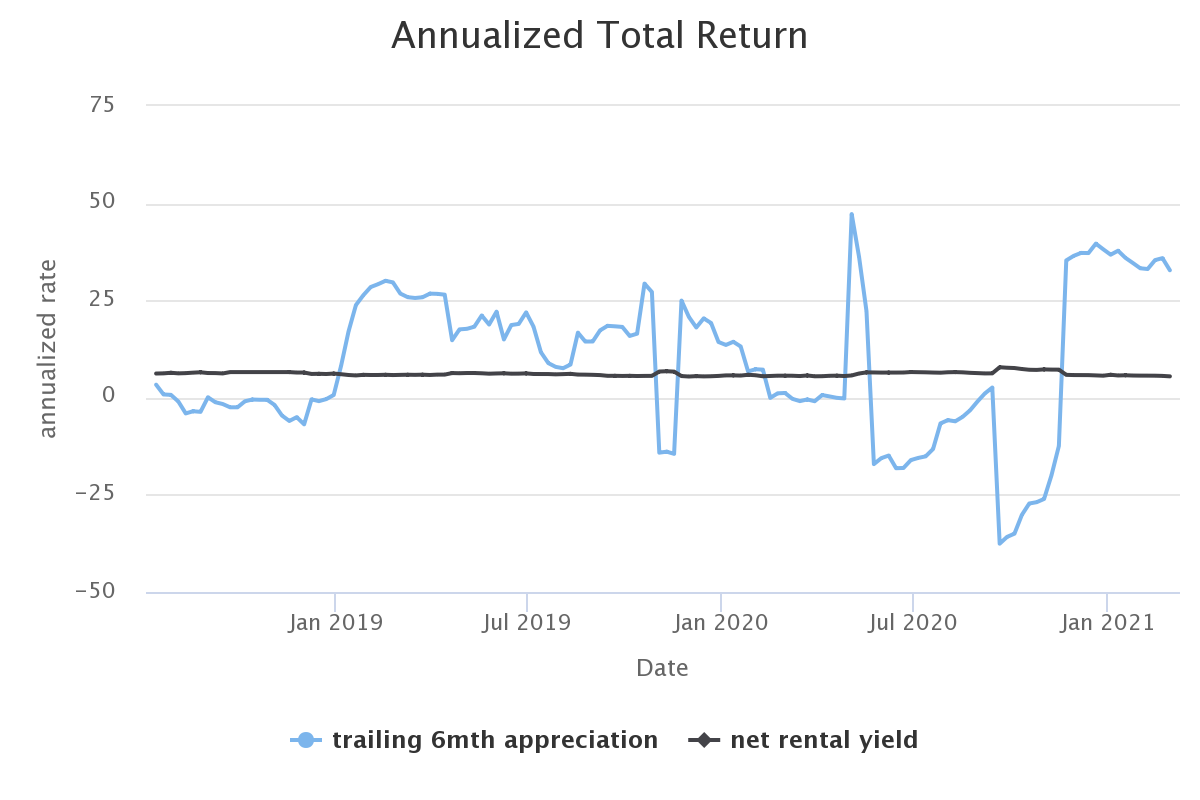
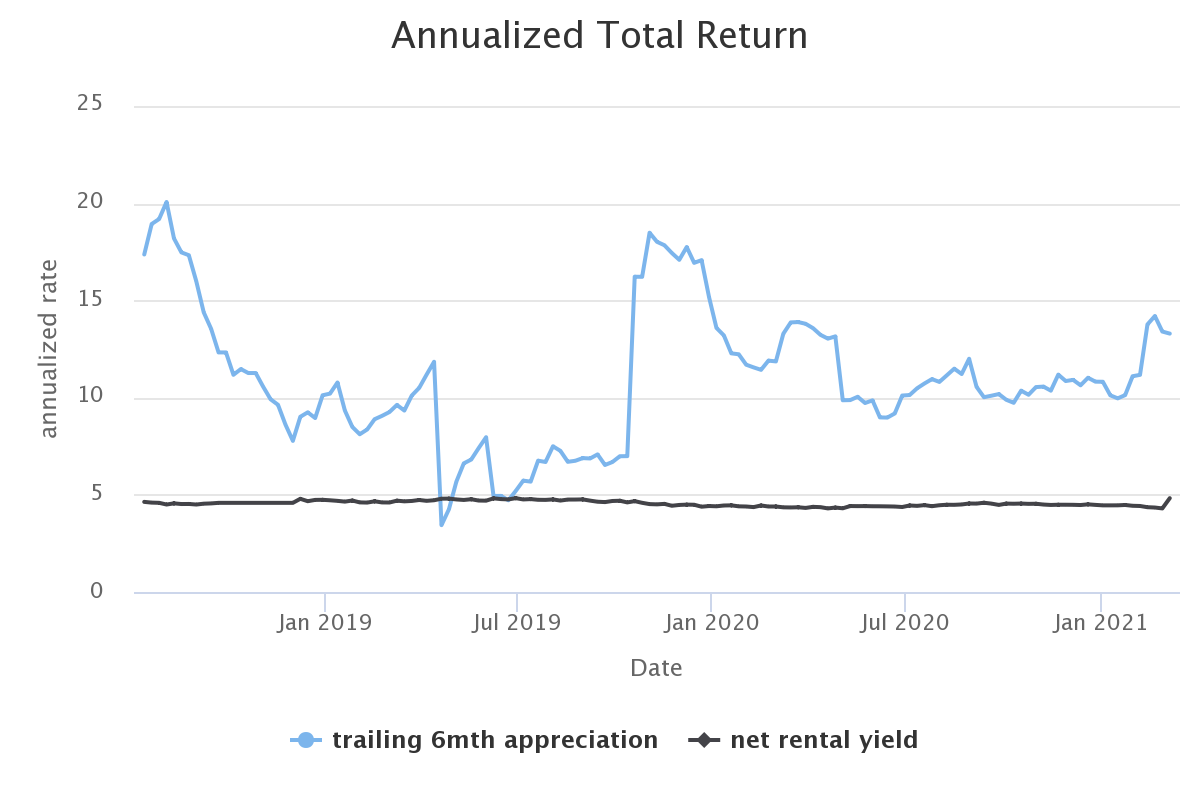
Houses are good inflation hedges. Markets can be capricious, and there is a significant risk in holding real estate for a few years. Capital gains are a source of profit, but an unreliable one. Rental yield is a measure of building's fundamental value, and that yield allows one to compare this investment with bonds or stocks.
Similar to gold bullions, houses are good inflation hedges, and their short-term price move is subject to animal spirits. Unlike gold bullions, a rental property is a productive investment that generates income and costs. We will next look at rental as a business activity and define of net income.
Net Income
When viewed as a rental business, an income statement from the activity has the following elements:
- gross income comes from rents and any other receipts (coin operated laundry...)
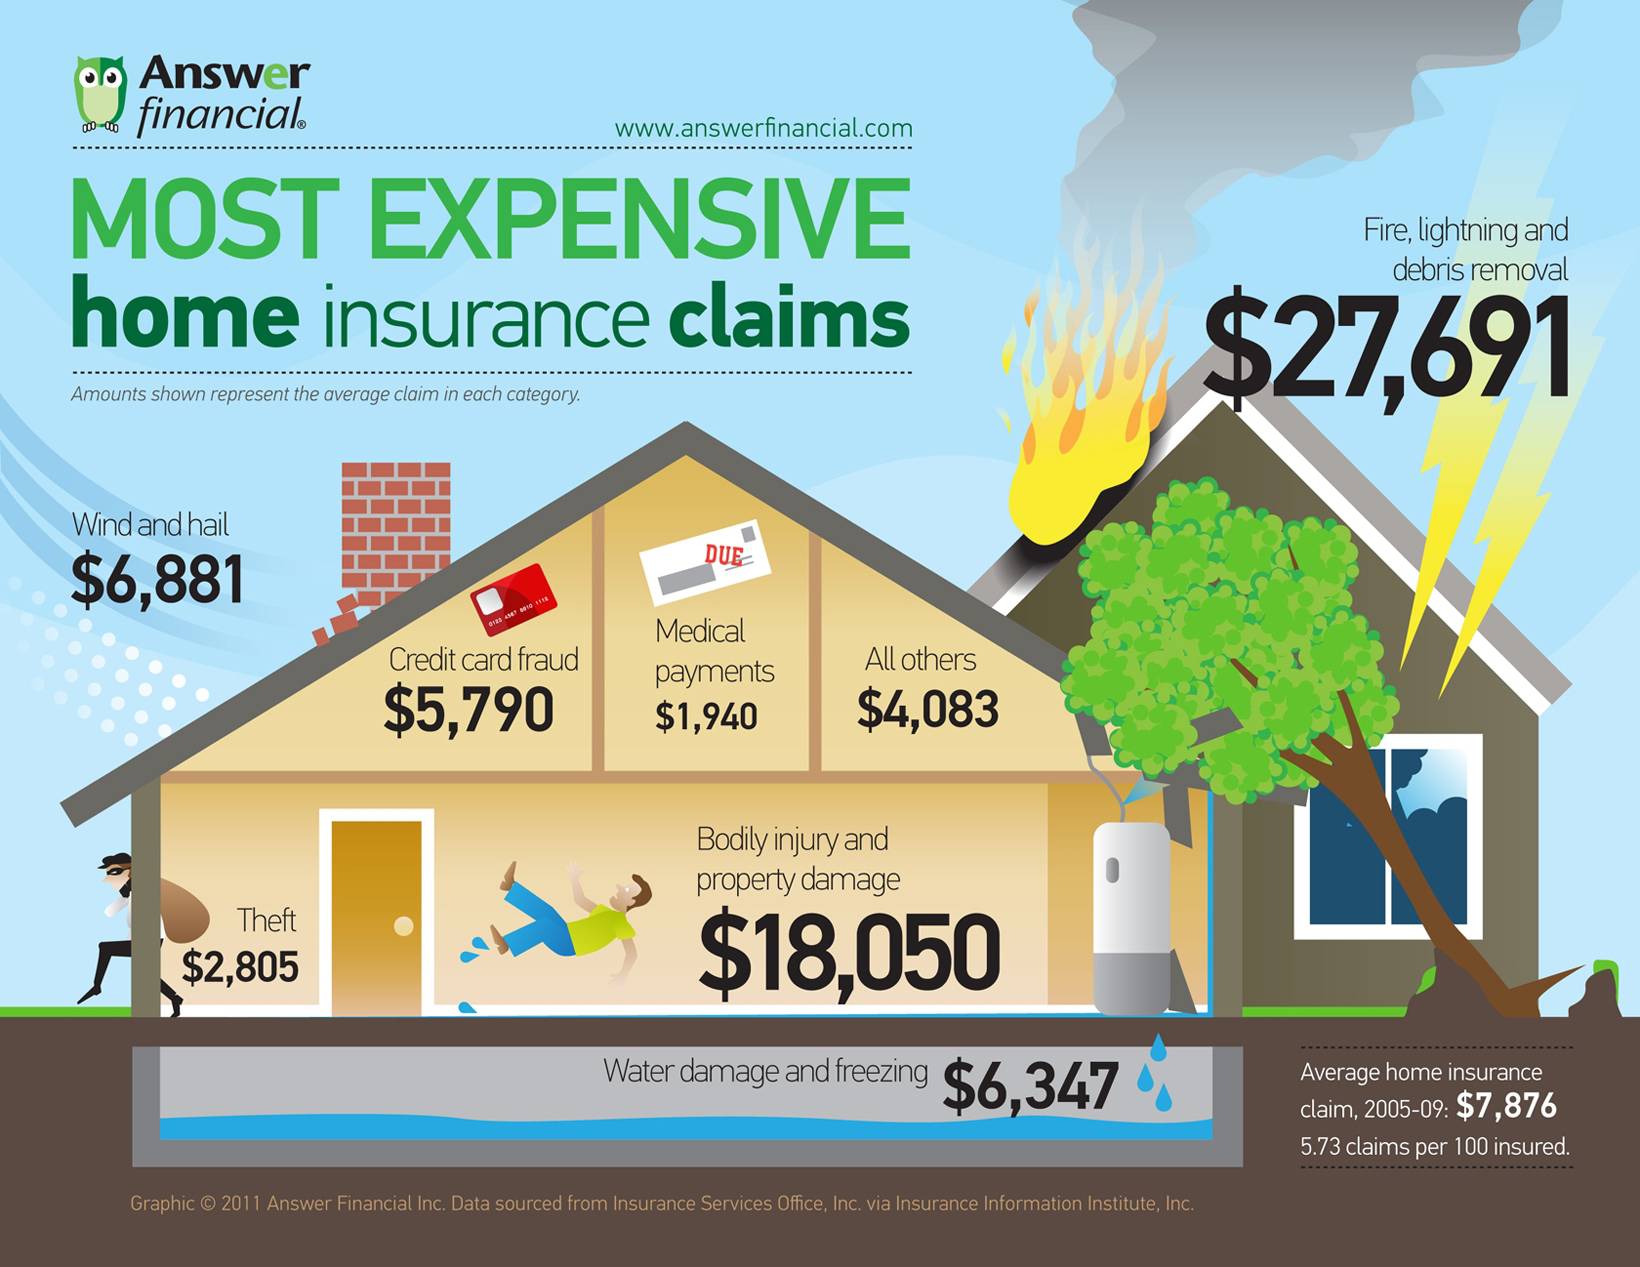
- operating expenses corresponds to insurance, fees, repairs, management fees, home office costs
- interest from mortgage and credit card need to be deducted
- depreciation from improvements and property that have a life above 12 months need to be deducted, although they can be amortized over the life of the improvement.
- net income = gross income - expenses - interest and depreciation
If spending is categorized as an operational expense, it is fully deductible from income for that year. If it is categorized as a capital expenditure (e.g., if it is an improvement rather than a repair), it needs to be depreciated, which means that the deduction will occur over the life of the expenditure.
We'll review this definition in the section about tax, as net income is what the IRS uses to determine rental income.
Profitability and Solvency Measures
The following section deals with finance computation. Going through this will enable you to do the comparative analysis of investments, to know which one is safer, and which one will double your money faster. You might want to skip this section if you are not in a mood for learning difficult (but rewarding) concepts. It is a dry topic that requires focus, so you may skip this section and return to it when you are ready for a more technical read.
It is one thing to compare the investment potential of similar properties, and another to get the right metrics to analyze investments. You need to know in absolute terms how well your investment is supposed to make.
The following measures will help you determine the intrinsic profitability or a real estate investment. To keep the formulae simple and straightforward, all the income and expense numbers should be annual, and a yield calculation giving 0.05 means 5%, a yield of 0.11 gives 11% to avoid seeing factors 100 show up at multiple places in every formula.
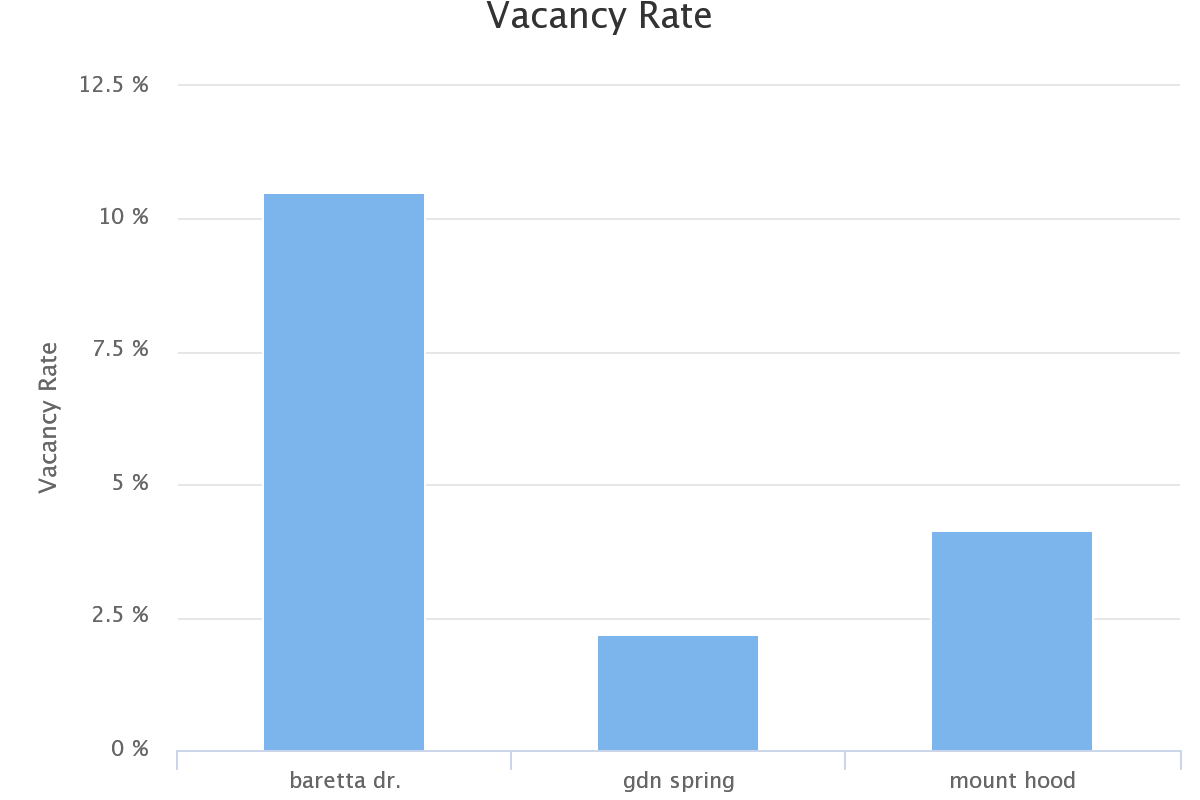
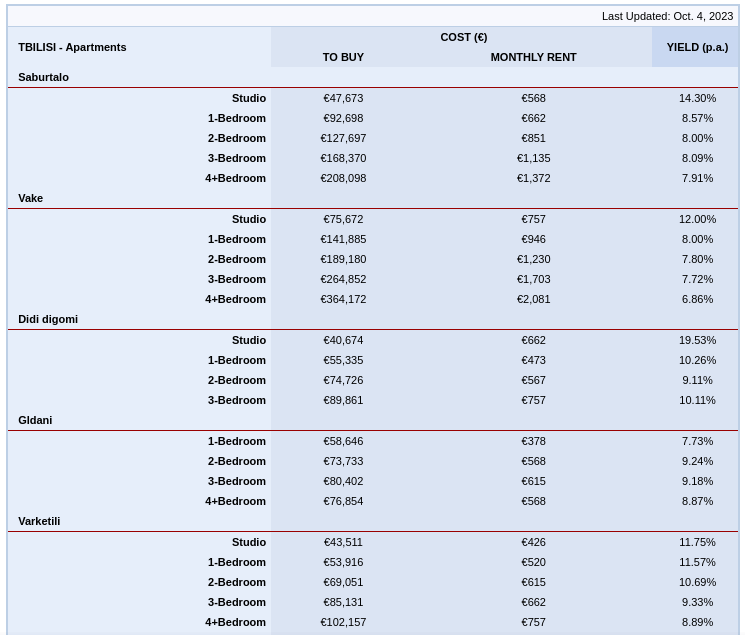
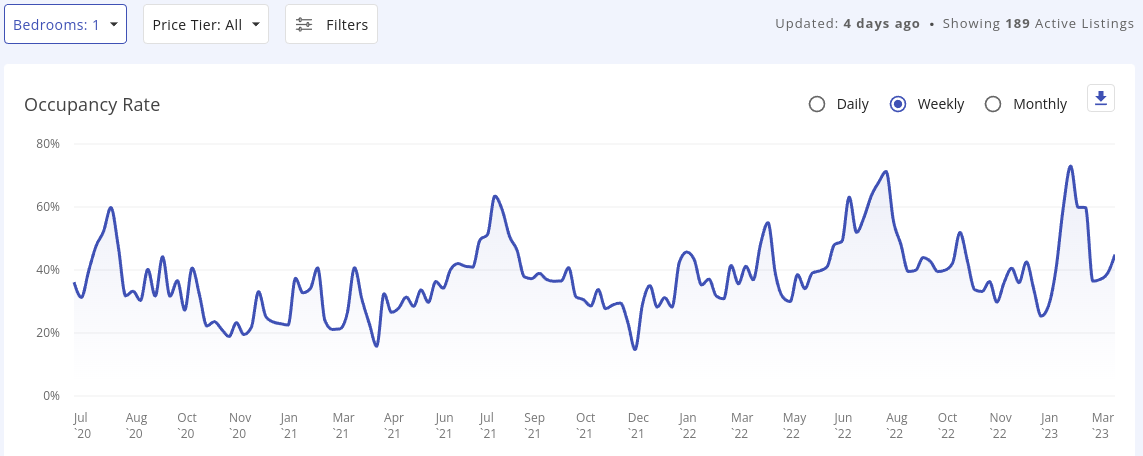
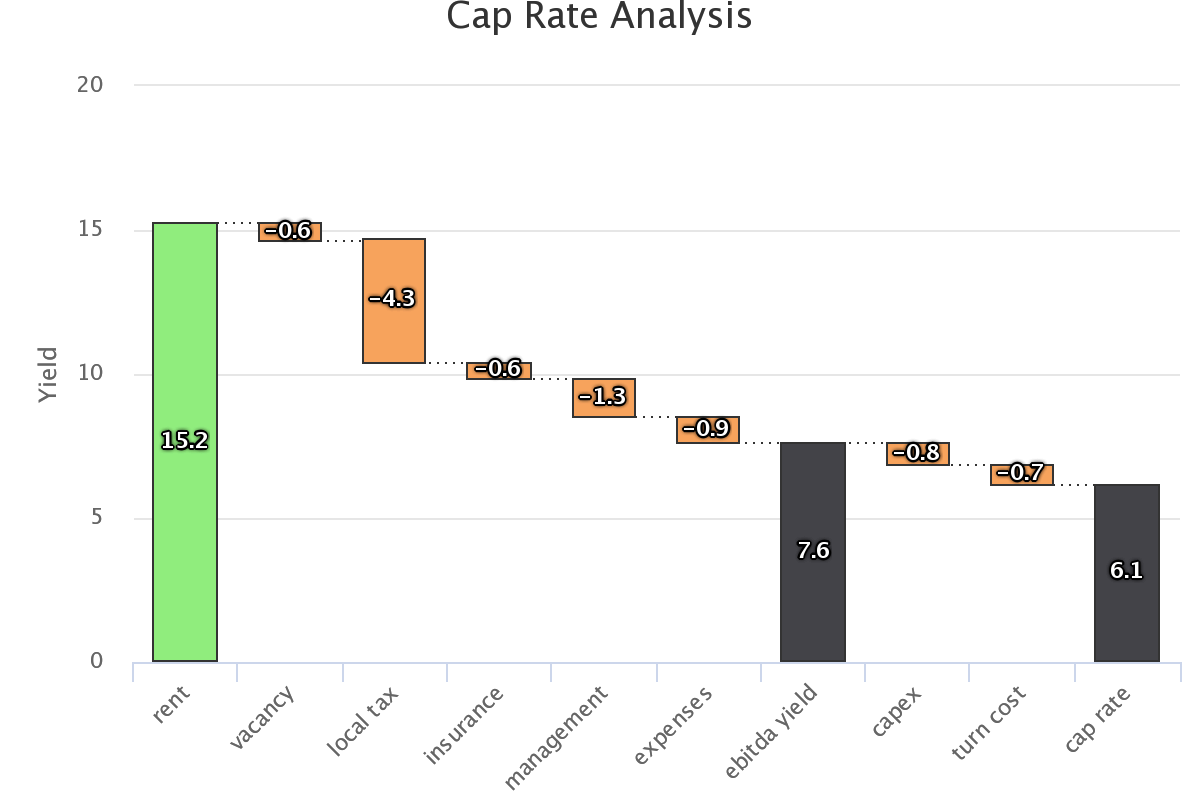
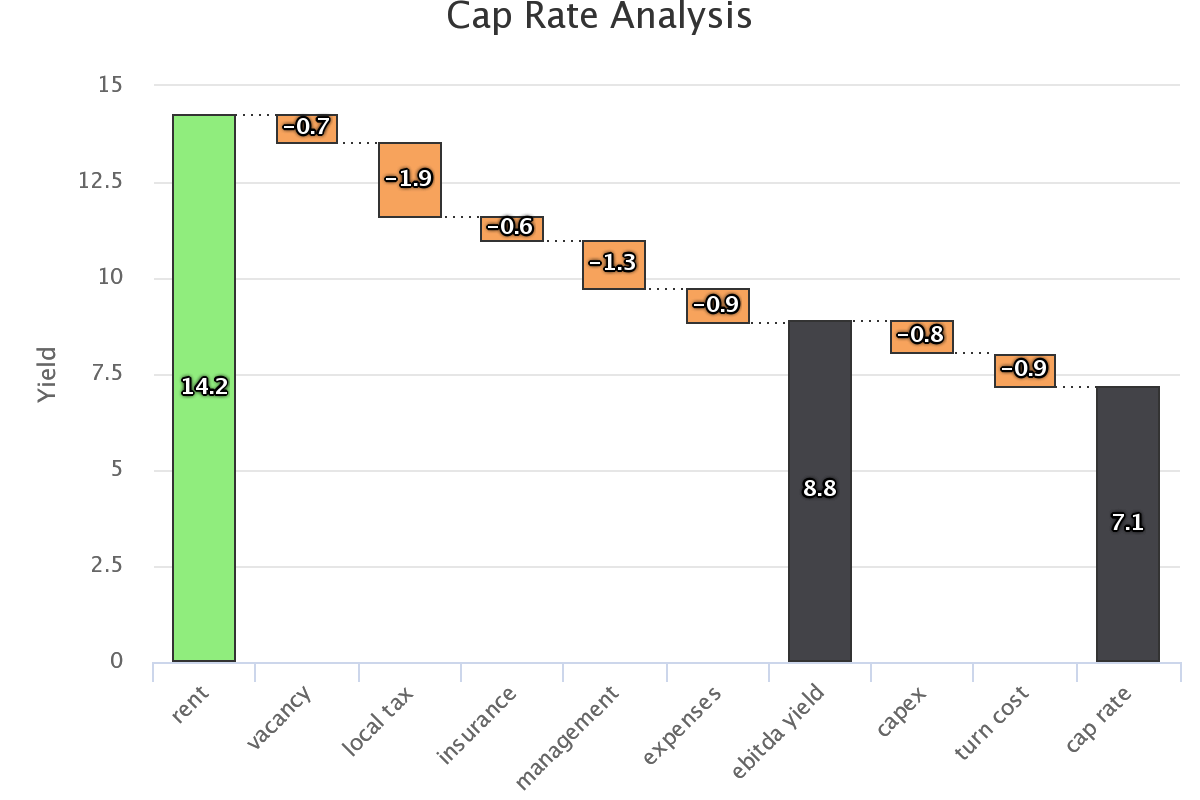
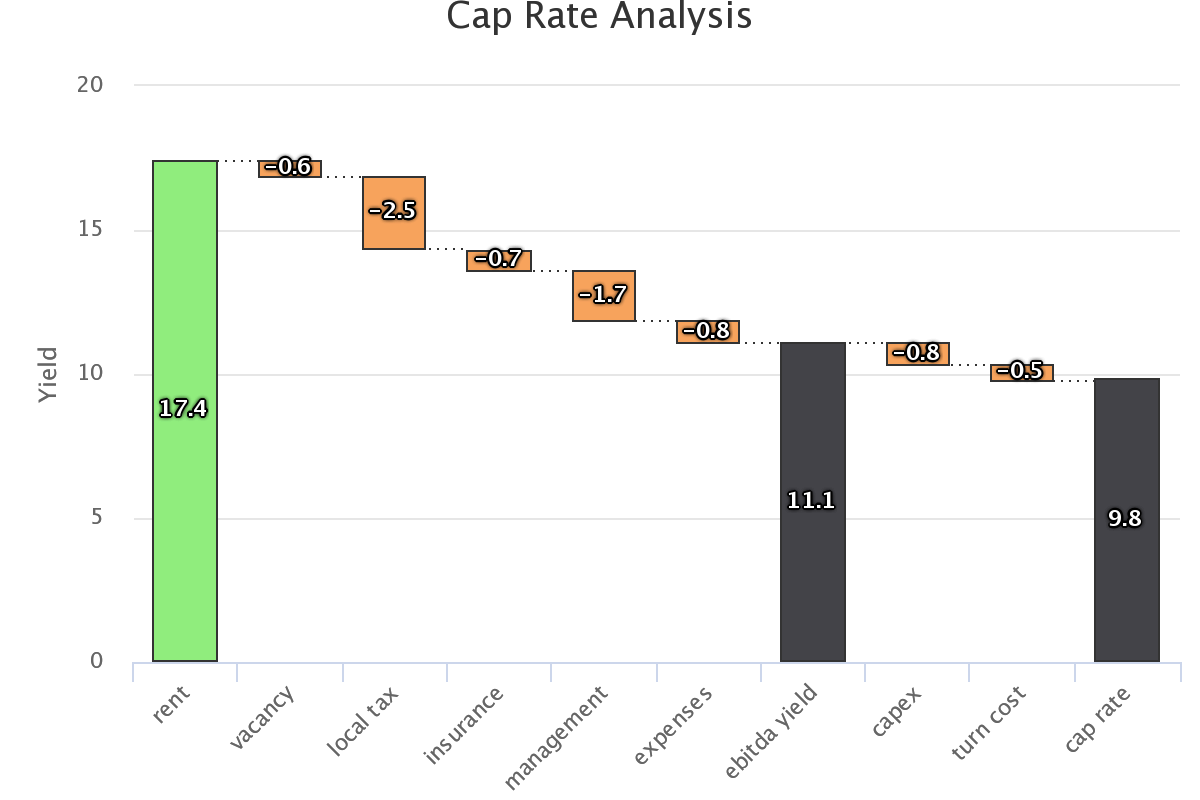
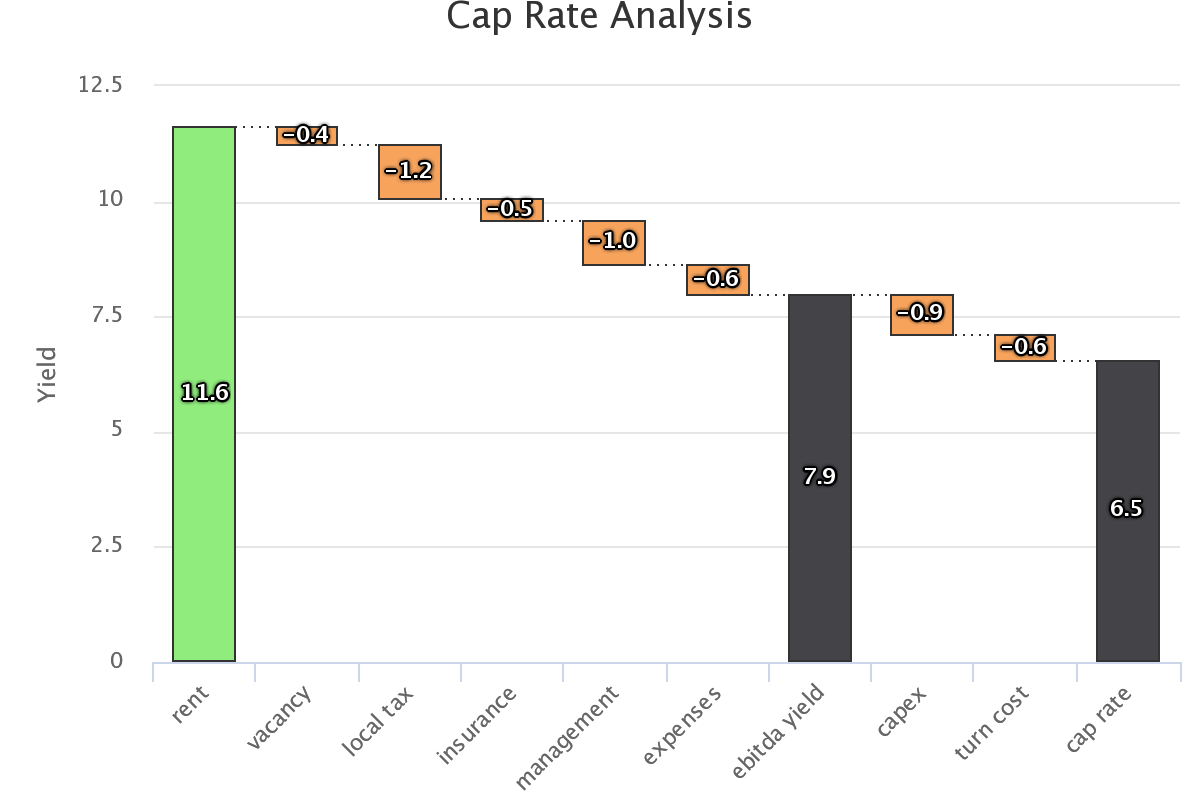
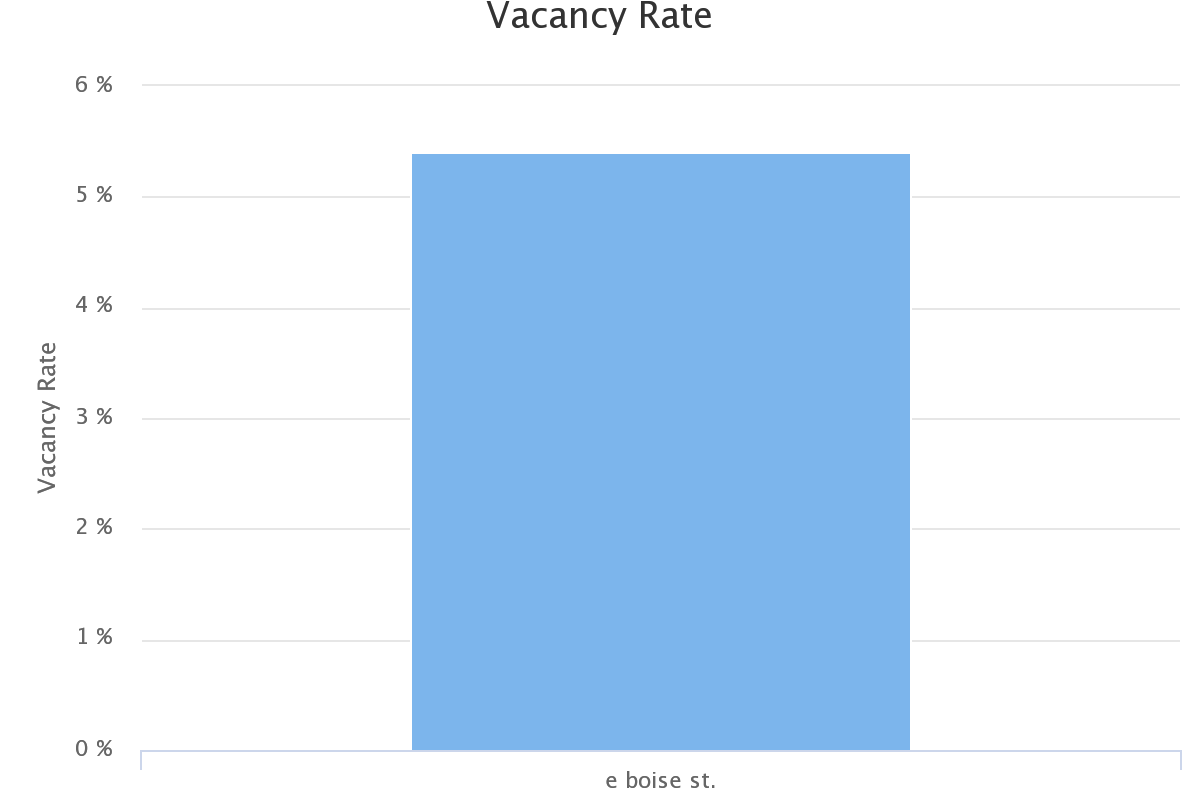
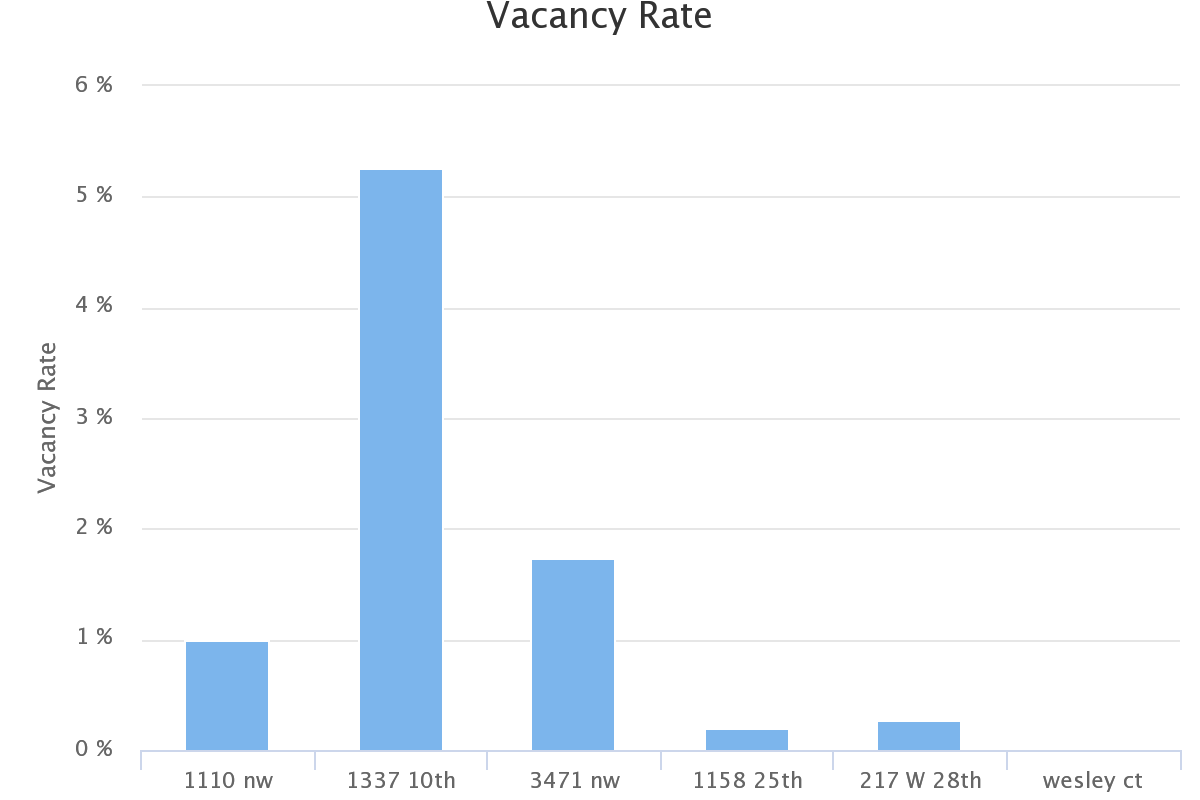
- gross yield=gross income/price: this is the gross annual rent. This tells you how much your gross receipts from the properties are in the best case. Note that the actual gross yield will be much lower if the rental is left vacant. One generally includes a statistically realistic estimate for vacancy, but each year will have a different vacancy rate. The gross yield is generally in the 10%-14% range for profitable cashflow properties.
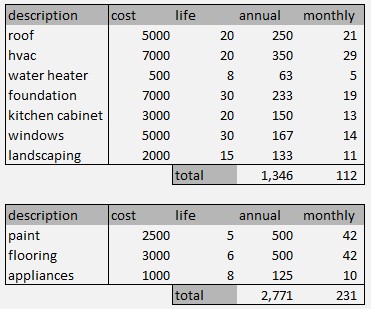
- expense rate=expenses/price: where expenses correspond to annual expenses for the property. You would expect some money on repairs, local property tax, insurance, management, and any other expense that are commonly deductible. Depending on area, you can expect (0.5%-3%) property tax, 0.5%-1.5% insurance, 1% management cost. Repairs will be anywhere between 0%-1% on good years, 2% on less lucky years. This means an expense ratio of 3%-6% for the property. You should look for properties with low fixed expense ratio, as having high expense will make your situation difficult if the gross income is lower than anticipated due to vacancy.
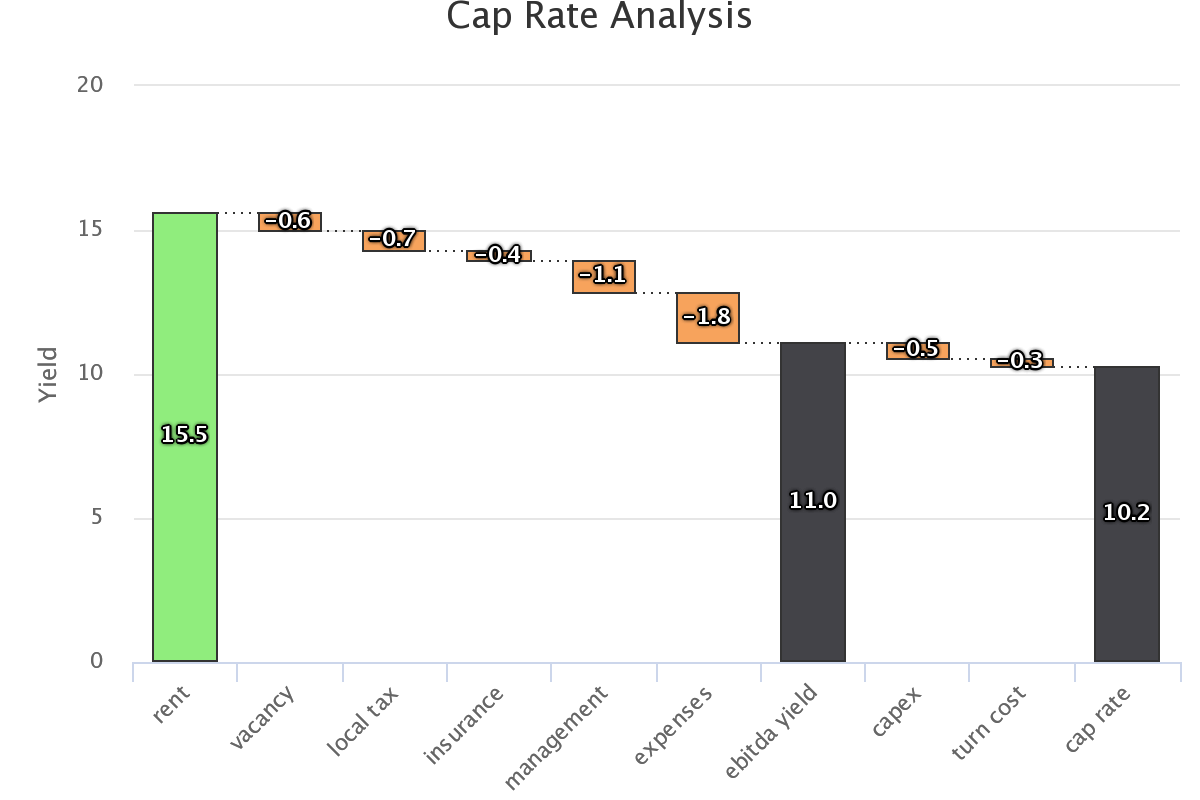
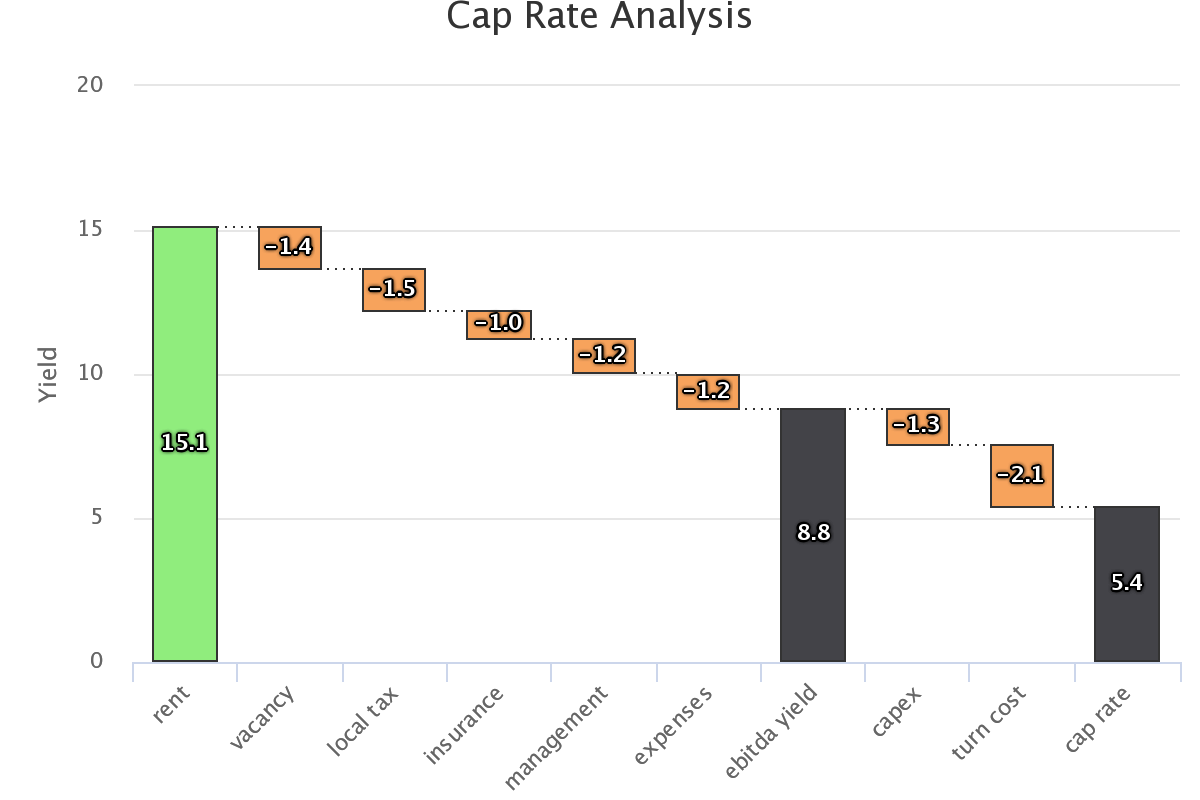
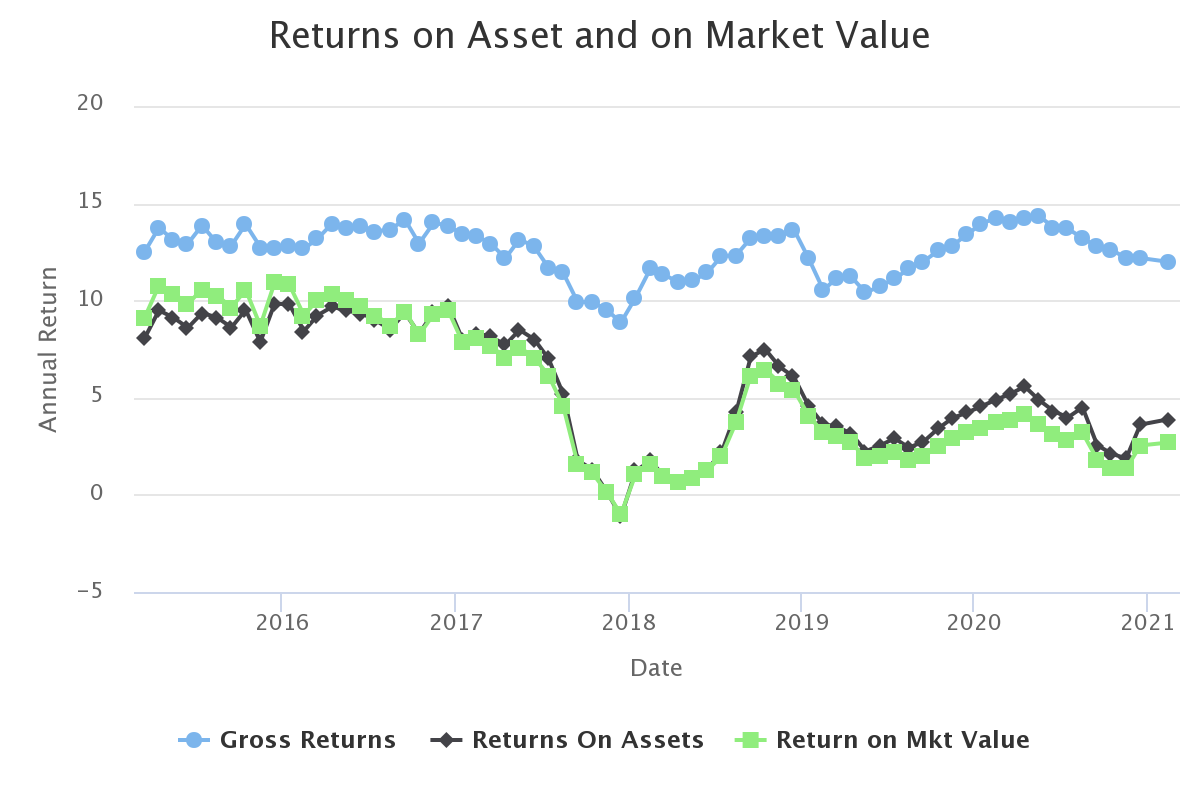
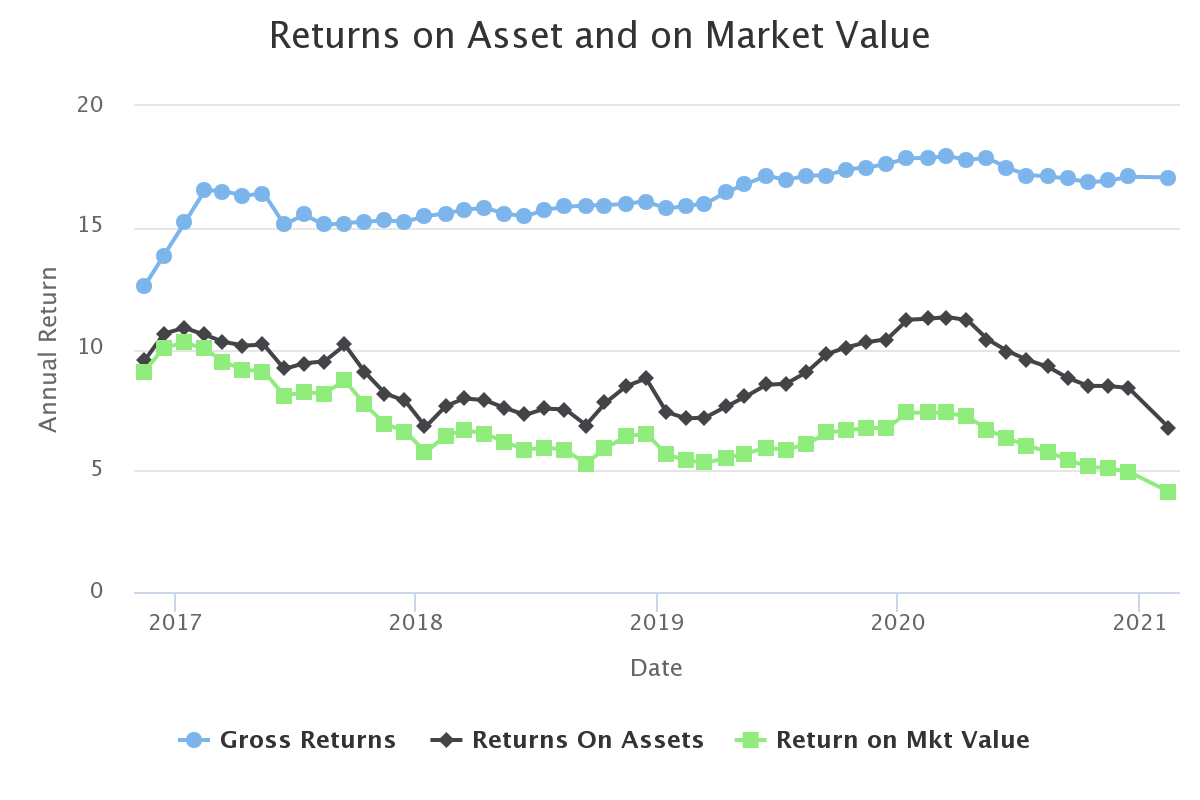
- capitalization rate=gross yield-expense rate: This number gives you the intrinsic profitability of the property, independent of the financing you choose. As a yield net of expenses, it also tells you the property the margin of safety seen as an investment. Capitalisation rate measures how this investment value grows if the property is bought cash. The income net of expenses is also called EBITDA (earning before interest tax and depreciation), and the cap rate is also called the EBITDA yield of the rental activity.
The following measures take into account the leverage that financing gives you:
- Loan To value Ratio (LTV)=(mortgage principal)/price is the number showing how big the loan is compared to the investment.
- leverage=price/(price-mortgage principal)=1/(1+LTV) is the number showing how much leverage the mortgage is allowing for your investment. A mortgage with a LTV (Loan To Value) ratio of 0.95 gives you a leverage of 20, LTV=0.8 gives you a leverage of 5, LTV=0.5 gives you a leverage of 2, while purchasing cash LTV=0 results in leverage=1.
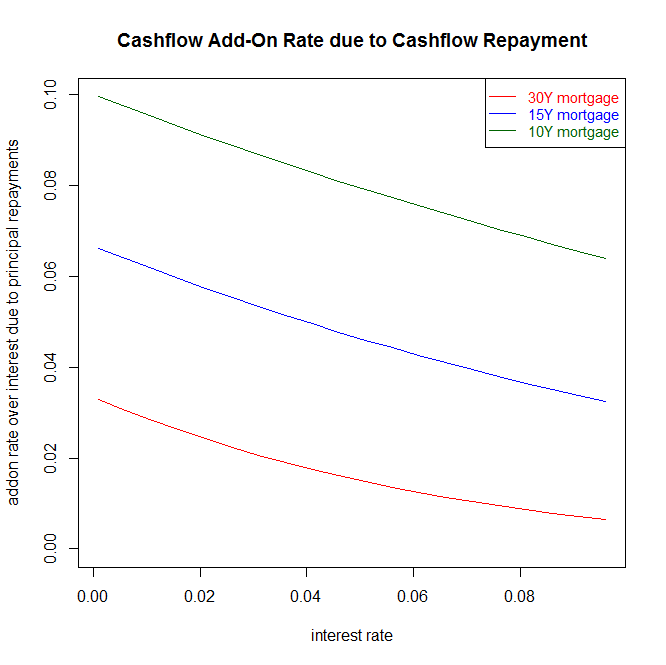
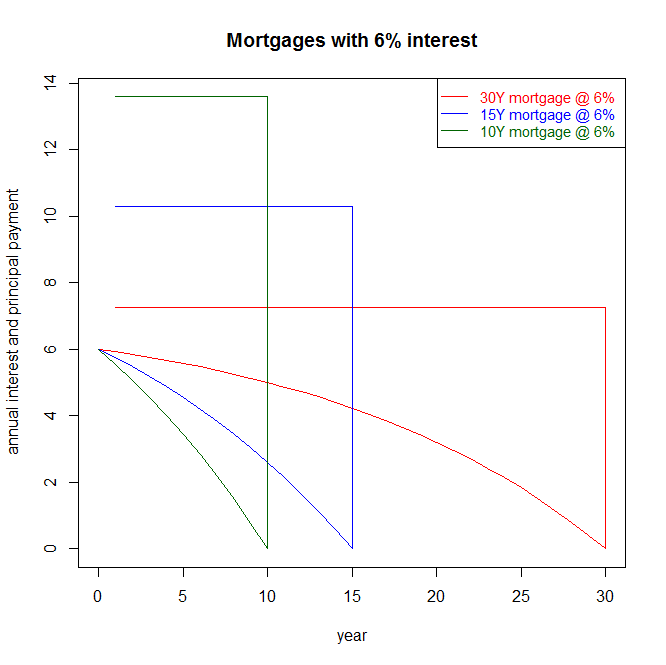
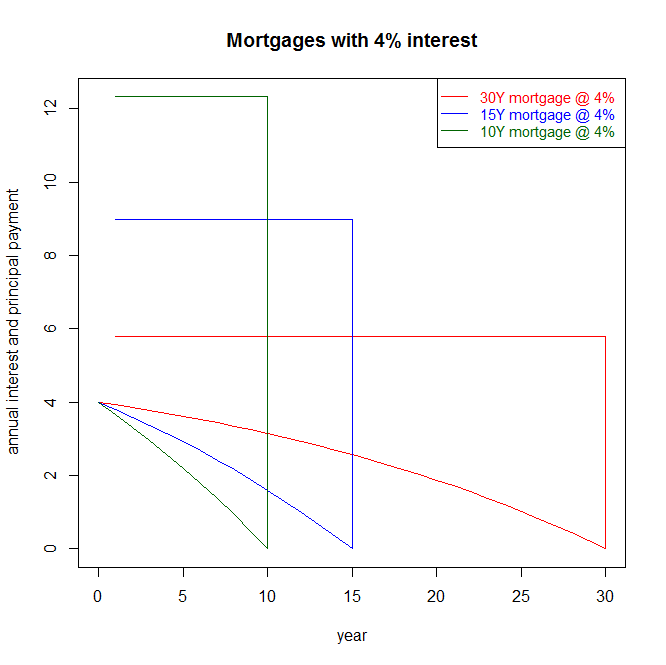
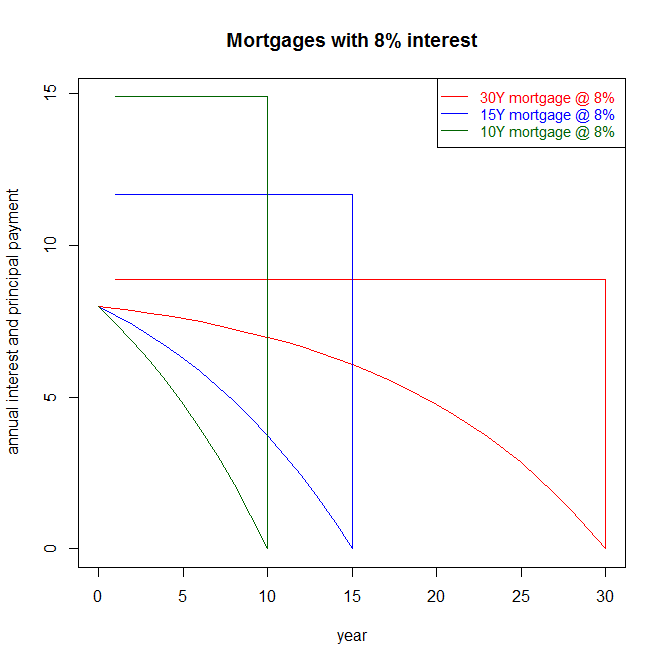
- cash on cash rate=leverage x (gross income-expenses-mortgage pmt)/price. This measure shows you how much cash flow will be generated by your investment given the amount of cash invested initially. This will be linked to the cap rate as follow: cash on cash = leverage x (cap rate-interest rate-addon repayment rate). The addon repayment rate is dependent on mortgage term and interest rate, it is 1/NbYear when rates are 0, but lower when rates increase. For 30Y, the addon repayment rate will go down from 2% to 1.25% for rates in the 3%-7% range. This is a solvency ratio.
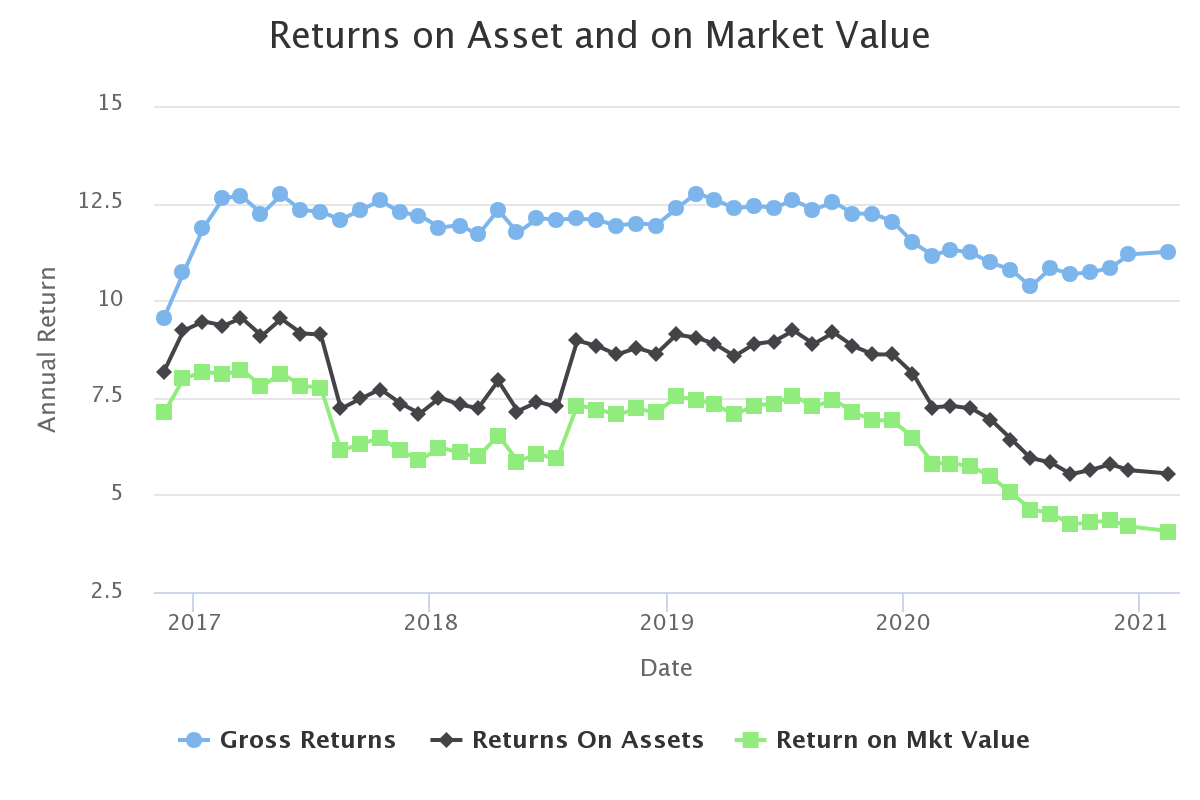
- irr (internal rate of return)=leverage x (gross income-expenses-mortgage interest)/price. This measure the leveraged net investment yield without taking into account the mortgage principal repayments. It will be linked to the cap rate by irr=leverage x (cap rate-mortgage rate). This number shows how the financing you obtained in increasing the property profitability. The difference with the cash on cash rates is the mortgage add-on rate, and this number shows the true profitability of the investment, and should be used for relative value computation.
Note that the last 2 rates include the effect of financing in the profitability computation. They involve a leverage multiplier which is applied to both gross income and expenses. The higher the leverage, the bigger the difference between pro-forma irr and actual irr. You will find that gross rate and cap rate are relatively stable estimates, while cash on cash and irr are much more uncertain given the leverage.
One more element is needed to understand how the tax authorities view your property income: the depreciation. The IRS considers that a real estate property has a useful life of 27.5Y, which means that 3.6% of the property value can be deducted every year. The depreciation applies to the house but not to the land, in case the house is estimated to be worth 0.8 the total property price, the depreciation is 0.8 times 3.6% or 2.9%.
- depreciation rate=(building value)/(building+land value)/27.5. The irr net of depreciation would be irr=leverage x(cap rate-mortgage rate-depreciation rate)
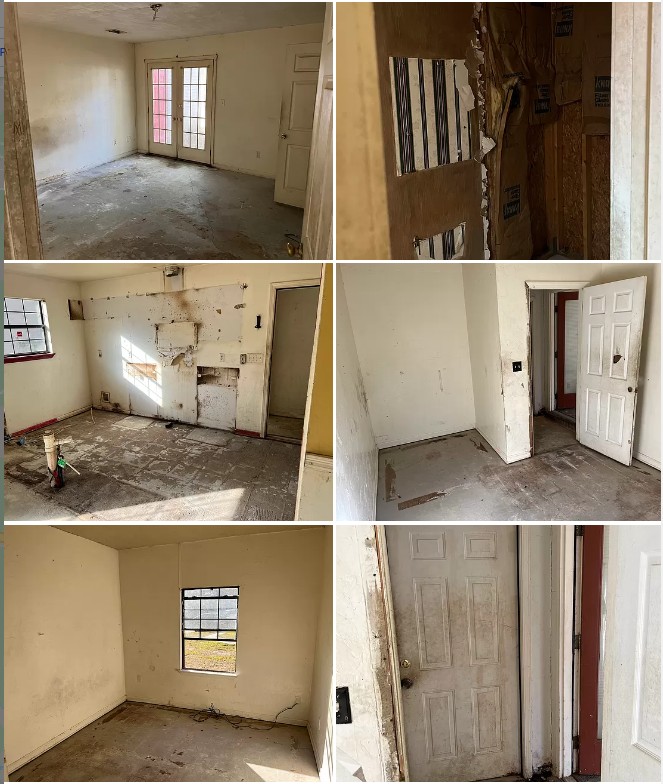
Houses have been around for hundreds of years. Since most of them were either fully rebuilt, or have undergone major renovations of their plumbing and electrical installation in the last 50 years, some owners must have paid for these. While the optimist will assume they can sell the property at an appreciated price, there are large repairs and improvements that you will need to pay if the property is kept for a long time.
You will need to refresh the property and update it to standards every 15 or 30 years. So having a long term reserve set aside for such work makes sense.
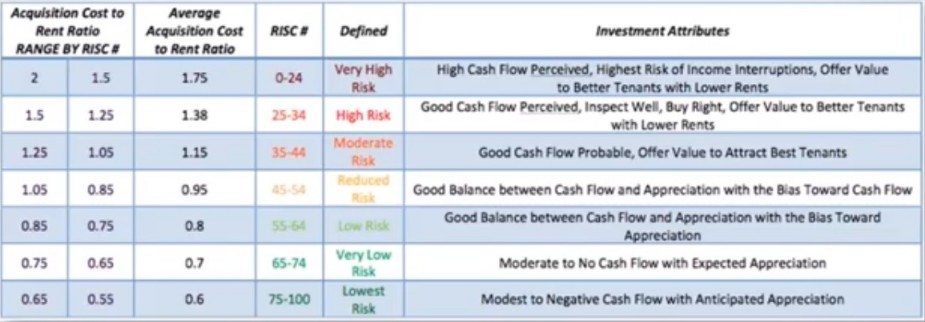
If you invest in a property that has good demographic trends, and prices compare favorably with replacement value, you might decide that the IRS is too pessimistic and it would be more realistic to include an appreciation rate than a depreciation. On the other hand, it is most likely that properties with a yield above 12% will not appreciate as they usually only appeal to high yield investor.
We finish with a last measure:
- taxable net yield=cap rate-LTV x interest rate-depreciation rate.
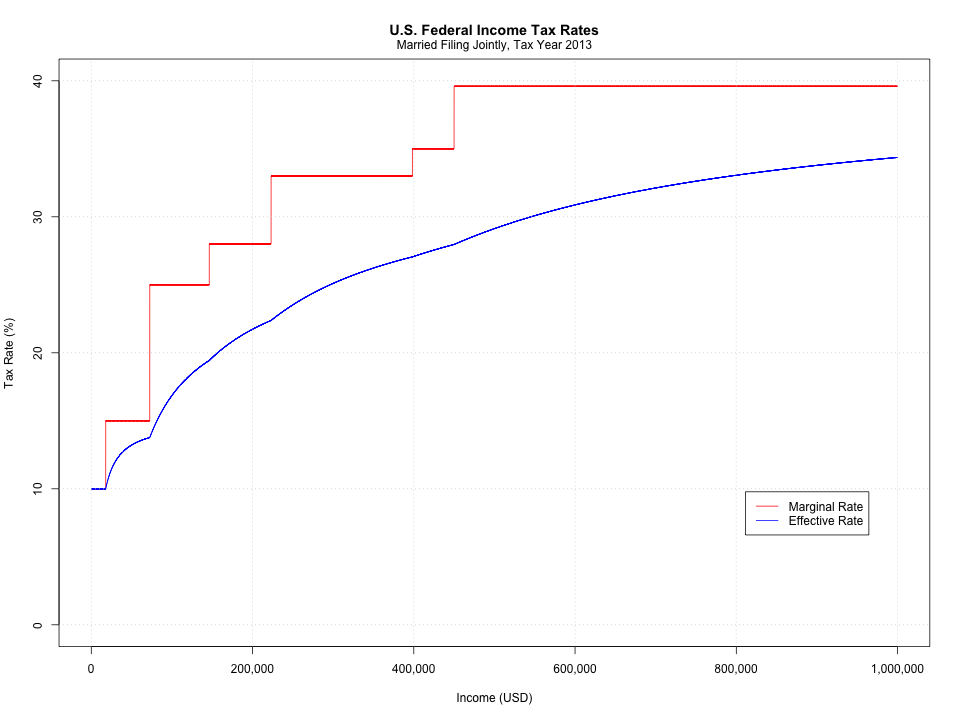
Whatever your assumptions to compute appreciation/depreciation for the property, your investment income will be taxed at your marginal tax bracket rate computed on the net taxable yield, which is the cap rate, net of mortgage interest if any and depreciation rate. For a property that with a 80% LTV mortgage at 5%, the interest deduction will be 4% and the depreciation deduction will be a further 2.6%. That means that the first 6.6% income from the cap rate is not taxable, and the rest is taxed at your marginal rate.