UK Residential Prices at Risk
Political Preamble
The month of June 2016 was marked by the decision of the British people to exit the EU. There is much uncertainty about the what the political future holds, currency and stock markets quickly reacted negatively to the news, and appear to price in some probability for upcoming economic turbulence, in contrast, UK house prices do not react quickly to such news: we will see lower volume first.
We do not know yet what scenario will play out. However, we can get some data concerning real estate prices and their evolution in the UK to see how prices arrived where they are now.
UK Residential Prices Pattern: Size and Location
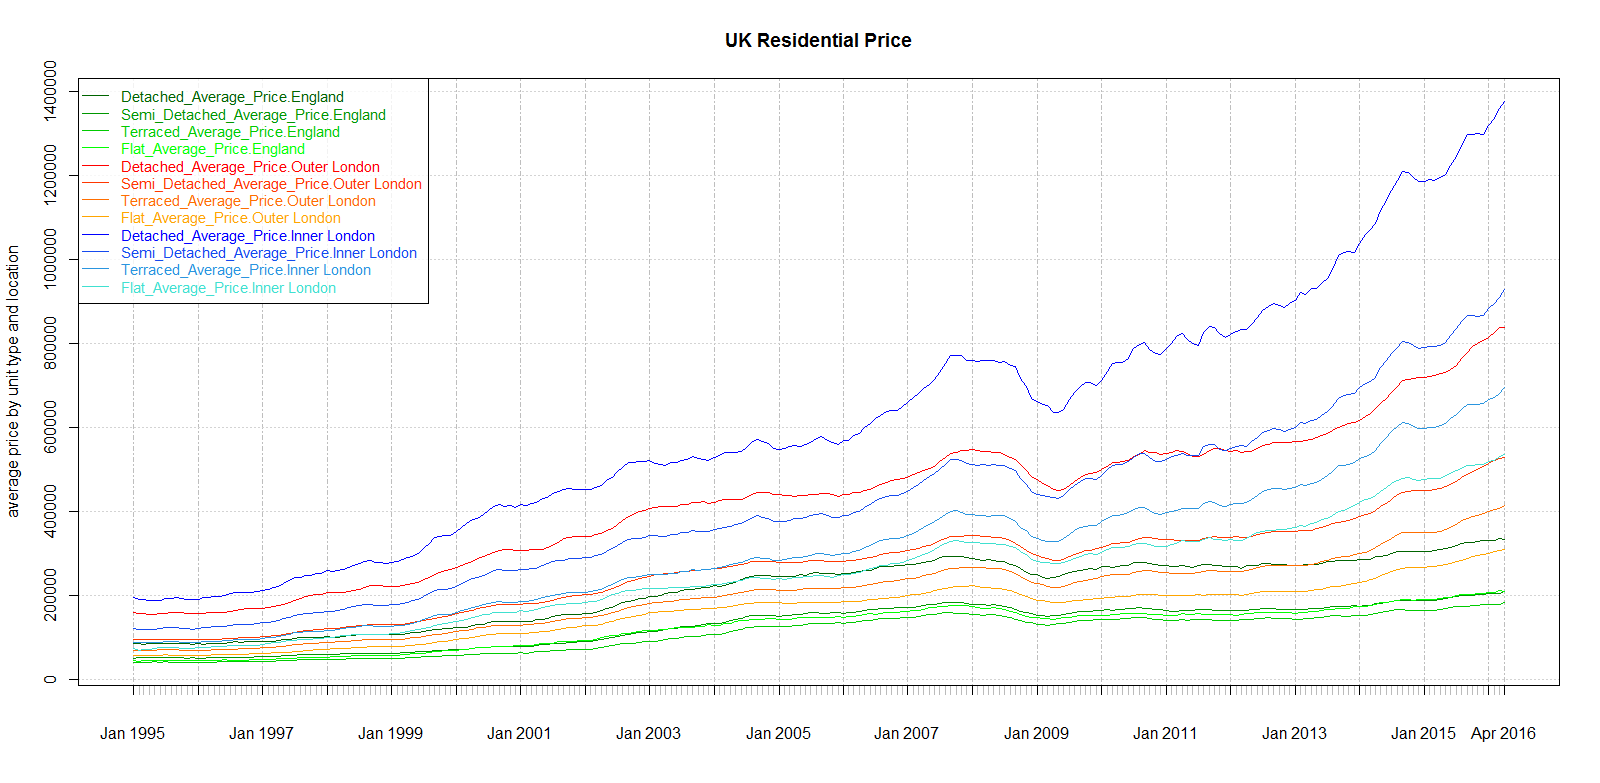
We show graphs obtained from house price data published here by the UK government. The data dates back to 1995, 3 years after the 1992 currency crisis that saw floating rates adjust at 15% (most mortgages in the UK are floating) and eventually forced the British currency out of the ERM (European Exchange Rate mechanism). In 1995, house prices had barely recovered from the 1990 recession and ensuing rates crisis and were starting a long ascent.
We see that average house prices start and end at very different levels depending on the type of residential unit and its location. Size and location do indeed matter when it comes to price:
The 2009 Financial Crisis: only one year lost for UK Home Prices
The financial crisis had a tremendous impact on UK banks, many longstanding high street names collapsed and were consolidated into a few megabanks.
When we observe house prices, however, despite floating rate mortgage being prevalent, and UK borrowers helping themselves to high leverage, the pattern is nowhere as marked as in the US. Prices did stop to increase from Sep 2007 (when crisis went from mortgage to capital markets) to September 2008 (when major financial institution failed), homeowners earned just had a 0 return during that year.
After September 2008, the UK banking financial system was under threat and prices did go down, but real estate only lost one year of gains whereas stock investor lost a decade of gains.
While the London market proved much less resilient than the New York property market, it should be noted that it was resilient when compared to the stock market.
Price Appreciation Pattern: location location location
We see below the appreciation rate that corresponds to the price trajectory. We see here that what mostly matters when it comes to price appreciation is the location. Price increases do trickle down from one property type to another, and only then do general price levels increase in other locations.

Pre-crisis Pattern: Trickle Down Effect
Before the crisis, price appreciation clearly started in inner London, with a frothy head start as soon as 1995. Cumulative annualized rates finally equalized outer with inner London in 2003, and with England average levels with London in 2005. We see inner London average increase plateauing at 15% while the rest of England real estate is slowly catching up from 2000 to 2005.
Post-crisis Pattern: the New Normal
After the crisis, one year with a 0% growth rate and one year with negative growth did much damage to the average growth rate. This appears to stabilize at high rates of 10% for inner London, 8% for outer London, and decaying even further for the rest of England. These rates are high compared to the UK GDP growth, which is below 2% throughout this period.
Differential Accumulation: a social perspective
This section focuses on the domestic aspect of the UK market, we'll consider the question of foreign investment in the section below.
The annual appreciation rate of 15% was unsustainable given that the nominal UK GDP grew by less than 2% annualized over the same period. This implies that all London real estate owners became richer comparatively to the rest of the population. Real estate owners in the rest of the UK then did catch up on this capital appreciation, and only the landless were left out.
If a country's worker output increases by 2% a year while homeowner's wealth increases by 15% a year and stay invested in such an asset, there is differential accumulation. What happened in the UK is that people who borrowed with the most leveraged mortgage at floating rates that had to stay low for them to be able to repay were rewarded in a few years by capital appreciation far beyond what they could expect from their salaried activity. The mortgages available, tax incentives and appreciation rate made it more profitable to buy and flip properties than to work for a salary.
In the long run, nominal home values need to follow nominal GDP growth. UK economy would need to grow at 10% (which the UK never saw since 1955) or the increase rate needs to come down to 2%.
What can mitigate that is capital inflow from international investors,
Foreign Currency and International Investment
The British currency has a volatile history. After the 1990 recession, the UK, which has a current account deficit and trade deficit since the 80s could not sustain its currency peg with other currencies in 1992. This resulted in a devaluation of the pound.
Devaluations benefit exporters in advanced modern economies, as the lower prices allow selling more exports, and unlocks further economies of scale. These additional sales hurt their foreign competitors market share and increase their unit costs. One of the reasons why a single currency.was proposed for the EU.was to avoid competitive devaluations. For UK workers and people who own UK denominated asset, a devaluation comes as an instant loss when expressed in a foreign currency.
What we see is that the devaluation in 1992 allowed to boost UK GDP. In local currency terms, this benefited workers, but then, real estate owners started to benefit from this growth far more than the workers themselves.
During the 2009 crisis, the GBP had a major devaluation again, after that, the British economy started growing again, and again, London UK property prices grew much faster. There is anecdotal evidence that this is due to foreign investment. We also observe that there was no such growth on property prices outside of London.
The pattern appears to be one where the whole country is made poorer in USD or EUR terms at each devaluation, after which the economy recovers, and most of the benefit is then being accrued to the real estate holders rather than to the workforce.
Conclusion
Two takeaways from this, given data available before the Brexit:
- the doubling of house prices in inner London in the last 7 years, corresponding to a 10% annualized return is unsustainable given domestic GDP growth. It appears that the market was being boosted by chasing its own tail and then some by foreign investors.
- the rest of England is struggling to keep up with the frantic pace of appreciation in the capital. It managed to sustain a growth that defies that of the UK economy, but that effect appears to be waning.
| Tweet |
| |
| Click here to share this on BiggerPockets.com! | ||